EKMAN-2
EKMAN-2. Price of Jean ($). Quantity of Jeans sold (pair). Avarage Consumer Income ($). Advertising Expenditure ($). Avarage Price of Shirts ($). MARKET FORCES : DEMAND AND SUPPLY. 0 5 10 15 20 25 30 35 40. 80,000 70,000 60,000 50,000 40,000 30,000 20,000 10,000

EKMAN-2
E N D
Presentation Transcript
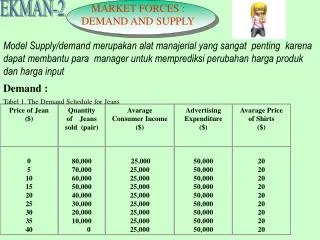
EKMAN-2 Price of Jean ($) Quantity of Jeans sold (pair) Avarage Consumer Income ($) Advertising Expenditure ($) Avarage Price of Shirts ($) MARKET FORCES : DEMAND AND SUPPLY 0 5 10 15 20 25 30 35 40 80,000 70,000 60,000 50,000 40,000 30,000 20,000 10,000 0 25,000 25,000 25,000 25,000 25,000 25,000 25,000 25,000 25,000 50,000 50,000 50,000 50,000 50,000 50,000 50,000 50,000 50,000 20 20 20 20 20 20 20 20 20 Model Supply/demand merupakan alat manajerial yang sangat penting karena dapat membantu para manager untuk memprediksi perubahan harga produk dan harga input Demand : Tabel 1. The Demand Schedule for Jeans
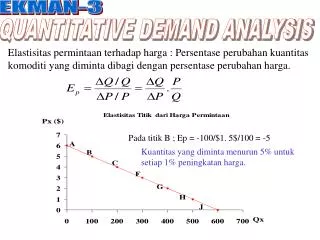
Riset pasar menyatakan : asumsi variabel lainnya konstan, maka jumlah jeans yang akan dibeli akan turun apabila harga meningkat. The Law of Demand : price and quantity demanded are inversely related. The price of good rises(falls) and all other things remain constant, the quantity demanded of the good falls(rises) (Price) Figure 1. The Demand Curve Quantity(thousnds per year)
Demand Shifters : Para ahli ekonomi : Variabel lain selain variabel harga dapat mempengaruhi permintaan, seperti (price of s/c, consumer income, advertising expenditures, and so on) disebut shifter The movement a long demand curve , A to B is called a change in quantity demanded. Whenever advertising, income or the pricesof related goods, population, consumer expectation change, it leads to change in demand, the position of the entire demand curve shifts. Price Figure 2 A Increase in demand decrease in demand B D2 D0 D1 Quantity
The Demand Function Seluruh faktor-faktor yang mempengaruhi permintaan : fungsi permintaan M = income H = value of other variable Fungsi permintaan : jumlah barang yang diminta tergantung harga dan shifter lainnya. Demand is linier if is a linier function of prices, and other variables that influences demand. The equation of linier demand function : Problem 2.1. Konsultan Ekonomi mengestimasi fungsi permintaan suatu Perusahaan yang memproduksi barang X sebagai berikut : : = 12,000 – 3PX +4PY - 1M + 2AX Apabila harga barang X adalah $200 per unit, barang Y $15 perunit, biaya iklan $2,000, pendapatan konsumen sebesar $10,000 Tentukan jumlah barang X yang terjual? Apakah barang y terhadap barang X substitusi atau komplemen ? Apakah barang X barang normal atau inferior? Gambarkan kurva permintaan?
QdX = 12,000 – 3(200) + 4(15) – 1(10,000) + 2(2,000) = 5460 unit Koefisien Py = 4>0, artinya jika harga y, naik $1, maka konsumsi barang X naik 4 unit. Barang X dan barang Y adalah substitusi. Koefisien M dalam persamaan adalah -1<0, artinya jika pendapatan meningkat $1, maka konsumsi barang X akan turun 1 unit. Barang x adalah barang inferior. Informasi dalam fungsi permintaan dapat digunakan untuk menggambarkan Kurva permintaan. Fungsi permintaan : QdX = 12,000 – 3Px + 4(15) – 1(10,000) + 2(2,000) QdX = 6,060 – 3 Px
Grafik menunjukkan hubungan antar harga (sumbu vertikal) dan kuantitas (sumbu horizontal), sehingga perlu ditentukan invers demand yaitu Px di sebelah kiri dan variabel lain disebelah kanan persamaan QdX = 6,060 – 3 Px menjadi Px = 2,020 – (1/3) QdX Price $2,020 Px = 2,020 – 1/3 QdX $6,060 Quantity
Exercises 1 2.1. pada fungsi permintaan yang sama, tentukan kuantitas dan gambarkan kurva permintaan apabila : a. Pendapatan naik menjadi $15,000 b. Harga barang Y naik menjadi $20 per unit Gampang…….? Saya akan kumpulkan minggu depan…
Consumer Surplus The demand curve reveals the amount of a product consumers will buy at a given price.Alternatively, the demand curve indicates the price a consumer would be willing to pay for each additonal unit of the good. Price Consumer Surplus Figure 3 Px0 Figure 4 0 Qx0 CS : Nilai yang konsumen dapatkan dari sejumlah barang tidak dibayar CS : sangat penting bagi manager karena menunjukkan ekstra money dari konsumen.
2.2. Demonstration Problem • Permintaan konsumen untuk produk perusahaan Rappins seperti pada • Gambar 3. Jika perusahaan menetapkan harga produk $2 per liter. • Berapa Pendapatan yang diperoleh perusahaan. • Berapa konsumen surplus yang diperoleh konsumen.
The Supply Function Seluruh faktor-faktor yang memengaruhi posisi kurva penawaran. Py = harga teknologi, W = harga upah, H = harga variabel lain. Supply Shifters : Variabel that effect the position of the supply curve : supply shifters. (price of input, the level of technology, the numbers of firm in the market, taxes, government regulation, and producer expectation) Problem 2 : Departemen Riset mengestimasi fungsi penawaran suatu produk X sebagai berikut : = 2,000 + 3PX - 4Pr - Pw , where Px is the price of TV sets, Pr is the price of computer monitor, and Pw is price of input used to make television. Suppose TVs are sold for $400 per unit comp. monitor $100/unit, price of input $2,000. How many television sets are produced? Supply function?
Answer : QSX = 2,000 + 3(400) – 4(100) – 1(2,000) = 800 Fungsi penawaran : QSX = 2,000 + 3Px – 4(100) – 1(2,000) QSX = 3 Px - 400 Price Inverse supply function : Px = 400/3 + 1/3 QSX S A B $400 $400/3 C 800 Quantity
Producers Surplus : Konsumen menginginkan harga serendah mungkin, dan produsen menginginkan harga setinggi mungkin. The supply curve reveals the amount producers will be willing to produce at a given price. PS : sejumlah kelebihan yang diterima produsen diatas harga tertentu sehingga mendorong produsen untuk memproduksi barang. PS is the area above the supply curve but below the market P of the good
Market Equilibrium Price S F G PH Surplus Pe Shortage A B PL D Quantity Q1 Qo Qe Problem 3 : The best estimates of the market demand and supply for the Russian good are given by : Qd = 10 – 2P and QS = 2 + 2P. Determine the competetive equilibrium price and quantity?
Price Restriction and Market Equilibrium Price Price Ceiling F Pf Lost Producer and Consumer surplus Pe A B Ceiling Pc Shortage Quantity Qs Qe Qd Price ceiling refers to that price being the highest permisible price in the market.(Harga yang paling tinggi diijinkan dalam pasar, tujuan untuk melindungi konsumen = berada di bawah harga keseimbangan)
Price Floors Price PF Floor Lost Consumer and surplus producer Pe Quantity Qd QS Qe Harga Dasar : Harga yang paling rendah diijinkan di pasar, tujuannya untuk melindungi produsen, berada diatas harga keseimbangan.
Exercises 2 Excercices 2 2. The demand for your product has been estimates to be = 7,880 – 4Px – 2Py + Pz - .1M. The relevant price and income • data are as follows : Px = 10, Py = 15, Pz = 50, M = 40,000 • Which goods are substitutes for X? Which are complements? • Is X inferior or a normal good? • How much X will be purchased? • Graph the demand curve for X given the above information? • How will the demand curve change if M falls to 35,000?
Problems Exercises 3 • 3. Suppose you are and aide U.S. Senator who is concerned about the • impact of a recently proposed excise tax on the welfare of her constituents • You explained to the Senator that one way of measuring the infact on her • constituents is to determine how the tax change the level of consumer • surplus enjoyed by the constituents. Based on your arguments, you are • given to go-ahead to conduct a formal analysis, and obtain the following • estimates of demand and supply : • Qd = 500 – 5P and Qs = 2P – 60 • Graph the supply and demand curve? • What are the equlibrium quantity and equilibrium price? • How much consumer surplus exist in this market? • If a $2 exice tax levied on this good, what will happen to the equili- • brium price and quantity? • e. What will the consumer surplus be after the tax?