Sketching Curves
410 likes | 443 Views
Learn how to sketch cubic equations and explore graph transformations. This chapter focuses on solving equations and finding intersections with axes. Practice exercises included.

Sketching Curves
E N D
Presentation Transcript
Introduction • This Chapter focuses on sketching Graphs • We will also be looking at using them to solve Equations • There will also be some work on Graph transformations
Sketching Curves Sketching Cubics You need to be able to sketch equations of the form: This involves finding the places where the graph crosses the axes, in the same way you do when sketching a Quadratic. A cubic equation will take one of the following shapes For any x3 or For any -x3 4A
Sketching Curves Sketching Cubics You need to be able to sketch equations of the form: This involves finding the places where the graph crosses the axes, in the same way you do when sketching a Quadratic. Example Sketch the graph of the function: If y = 0 or So x = 2, 1 or -1 (-1,0) (1,0) and (2,0) If x = 0 So y = 2 (0,2) 4A
Sketching Curves Sketching Cubics You need to be able to sketch equations of the form: This involves finding the places where the graph crosses the axes, in the same way you do when sketching a Quadratic. Example Sketch the graph of the function: (-1,0) (1,0) (2,0) (0,2) y or 2 x 1 -1 2 If we substitute in x = 3, we get a value of y = 8. The curve must be increasing after this point… 4A
Sketching Curves Sketching Cubics You need to be able to sketch equations of the form: This involves finding the places where the graph crosses the axes, in the same way you do when sketching a Quadratic. Example Sketch the graph of the function: If y = 0 or So x = 2, 1 or -1 (-1,0) (1,0) and (2,0) If x = 0 So y = -2 (0,-2) 4A
Sketching Curves Sketching Cubics You need to be able to sketch equations of the form: This involves finding the places where the graph crosses the axes, in the same way you do when sketching a Quadratic. Example Sketch the graph of the function: (-1,0) (1,0) (2,0) (0,-2) y or x -1 1 2 -2 If we substitute in x = 3, we get a value of y = -8. The curve must be decreasing after this point… 4A
Sketching Curves Sketching Cubics You need to be able to sketch equations of the form: This involves finding the places where the graph crosses the axes, in the same way you do when sketching a Quadratic. Example Sketch the graph of the function: If y = 0 or So x = 1 or -1 (-1,0) and (1,0) If x = 0 So y = 1 (0,1) 4A
Sketching Curves Sketching Cubics You need to be able to sketch equations of the form: This involves finding the places where the graph crosses the axes, in the same way you do when sketching a Quadratic. Example Sketch the graph of the function: (-1,0) (1,0) (0,1) y or ‘repeated root’ 1 x -1 1 If we substitute in x = 2, we get a value of y = 3. The curve must be increasing after this point… 4A
Sketching Curves Sketching Cubics You need to be able to sketch equations of the form: This involves finding the places where the graph crosses the axes, in the same way you do when sketching a Quadratic. Example Sketch the graph of the function: Factorise Factorise fully or If y = 0 So x = 0, 3 or -1 (0,0) (3,0) and (-1,0) If x = 0 So y = 0 (0,0) 4A
Sketching Curves Sketching Cubics You need to be able to sketch equations of the form: This involves finding the places where the graph crosses the axes, in the same way you do when sketching a Quadratic. Example Sketch the graph of the function: (0,0) (3,0) (-1,0) y or x -1 0 3 If we substitute in x = 4, we get a value of y = 20. The curve must be increasing after this point… 4A
Sketching Curves Sketching Cubics You need to be able to sketch and interpret cubics that are variations of y = x3 This will be covered in more detail in C2. You can still plot the graphs in the same way we have seen before. This topic is offering a ‘shortcut’ if you can understand it. Example Sketch the graph of the function: y y = x3 x 4B
Sketching Curves Sketching Cubics You need to be able to sketch and interpret cubics that are variations of y = x3 This will be covered in more detail in C2. You can still plot the graphs in the same way we have seen before. This topic is offering a ‘shortcut’ if you can understand it. Example Sketch the graph of the function: y y = x3 5 x A cubic with a negative ‘x3’ will be reflected in the x-axis -5 y = -x3 ‘Whatever you get for x3, you now have the negative of that..’ 4B
Sketching Curves Sketching Cubics You need to be able to sketch and interpret cubics that are variations of y = x3 This will be covered in more detail in C2. You can still plot the graphs in the same way we have seen before. This topic is offering a ‘shortcut’ if you can understand it. Example Sketch the graph of the function: y = (x + 1)3 y y = x3 1 -1 x When a value ‘a’ is added to a cubic, inside a bracket, it is a horizontal shift of ‘-a’ When x = 0: y-intercept ‘I will now get the same values for y, but with values of x that are 1 less than before’ 4B
Sketching Curves Sketching Cubics You need to be able to sketch and interpret cubics that are variations of y = x3 This will be covered in more detail in C2. You can still plot the graphs in the same way we have seen before. This topic is offering a ‘shortcut’ if you can understand it. Example Sketch the graph of the function: y y = x3 27 x 3 y = (3 - x)3 When x = 0: y-intercept Reflected in the x-axis Horizontal shift, 3 to the right 4B
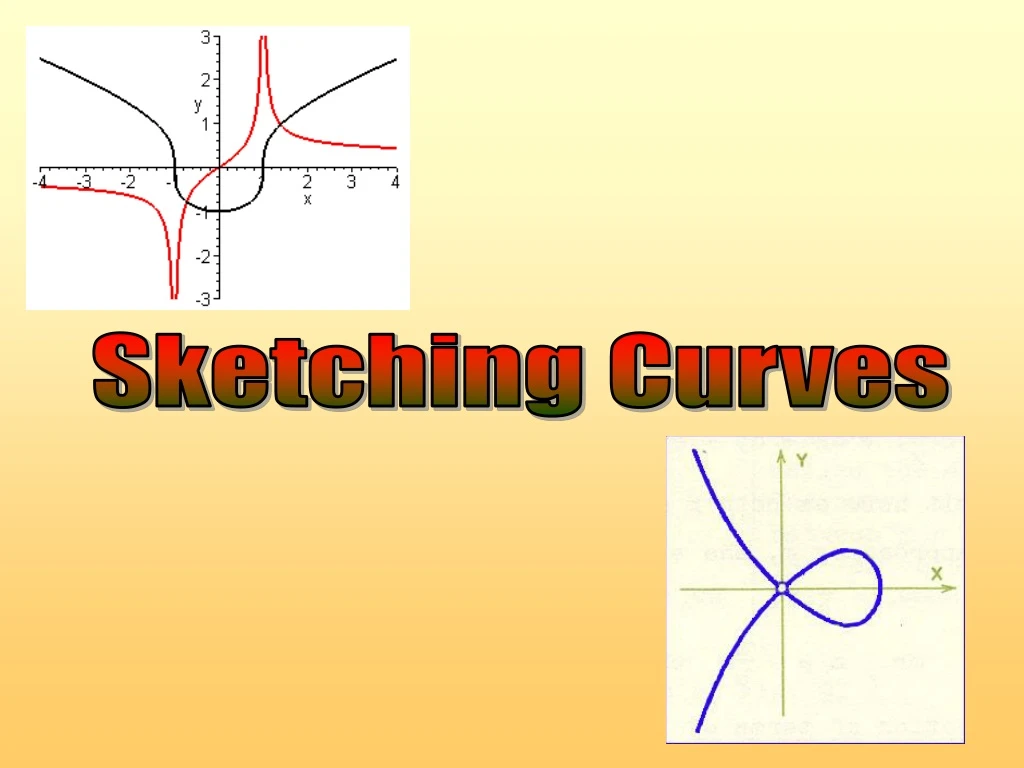
Sketching Curves The Reciprocal Function You need to be able to sketch the ‘reciprocal’ function. This takes the form: Where ‘k’ is a constant. Example Sketch the graph of the function These are where the graph ‘never reaches’, in this case the axes… and its asymptotes. y y = 1/x x -1 -0.5 -0.25 0.25 0.5 1 x y -1 -2 -4 4 2 1 You cannot divide by 0, so you get no value at this point 4C
Sketching Curves The Reciprocal Function You need to be able to sketch the ‘reciprocal’ function. This takes the form: Where ‘k’ is a constant. Example Sketch the graph of the function and its asymptotes. y = 3/x y y = 1/x x The curve will be the same, but further out… 4C
Sketching Curves The Reciprocal Function You need to be able to sketch the ‘reciprocal’ function. This takes the form: Where ‘k’ is a constant. Example Sketch the graph of the function and its asymptotes. y y = -1/x y = 1/x x The curve will be the same, but reflected in the x-axis 4C
Sketching Curves Solving Equations and Sketching You need to be able to sketch 2 equations on a set of axes, as well as solve equations based on graphs. Example On the same diagram, sketch the following curves: and y Quadratic ‘U’ shape Crosses through 0 and 3 x 0 1 3 Cubic ‘negative’ shape Crosses through 0 and 1. The ‘0’ is repeated so just ‘touched’ 4D
y x 0 1 3 Sketching Curves Solving Equations and Sketching You need to be able to sketch 2 equations on a set of axes, as well as solve equations based on graphs. Example On the same diagram, sketch the following curves: and Find the co-ordinates of the points of intersection These will be where the graphs are equal… Expand brackets Group together Factorise 4D
Sketching Curves Solving Equations and Sketching You need to be able to sketch 2 equations on a set of axes, as well as solve equations based on graphs. Example On the same diagram, sketch the following curves: and Find the co-ordinates of the points of intersection These will be where the graphs are equal… Expand brackets x=-√3 x=0 x=√3 Group together Factorise (-√3 , 3+3√3) (0,0) (√3 , 3-3√3) 4D
Sketching Curves Solving Equations and Sketching You need to be able to sketch 2 equations on a set of axes, as well as solve equations based on graphs. Example On the same diagram, sketch the following curves: and y Cubic ‘positive’ shape Crosses through 0 and 1. The ‘0’ is repeated. y = 2/x x 1 0 Reciprocal ‘positive’ shape Does not cross any axes 4D
Sketching Curves Solving Equations and Sketching You need to be able to sketch 2 equations on a set of axes, as well as solve equations based on graphs. How does the graph show there are 2 solutions to the equation.. Example On the same diagram, sketch the following curves: and y y = 2/x x 1 0 Set equations equal, and re-arrange And they cross in 2 places… 4D
Sketching Curves More Transformations You have seen that a curve with the following function: Will be transformed horizontally ‘-a’ units. A curve with this function: Will be transformed vertically ‘a’ units y f(x) + 2 f(x + 2) f(x) x 2 units up 2 units left f(x + 2) The x values reduce by 2 for the same y values f(x) + 2 The y values from the original function increase by 2 4E
Sketching Curves y f(x) More Transformations Sketch the following functions: f(x) = x2 Standard curve Label known points g(x) = (x + 3)2 Moved 3 units left Work out new ‘key points’ h(x) = x2 + 3 Moved 3 units up Work out new ‘key points’ x 0 h(x) y y g(x) 9 3 x x -3 4E
Sketching Curves More Transformations Given that: i) f(x) = x3 Sketch the curve where y = f(x - 1). State any locations where the graphs crosses the axes. f(x) = x3 f(x – 1) = (x – 1)3 So for this curve, when x = 0, y = -1 It therefore crosses at y = -1 y f(x) x 0 1 -1 f(x – 1) 4E
Sketching Curves More Transformations Given that: i) g(x) = x(x – 2) Sketch the curve where y = g(x + 1). State any locations where the graphs crosses the axes. g(x) is a positive quadratic crossing at 0 and 2. g(x) = x(x – 2) g(x + 1) = (x + 1)(x + 1 – 2) g(x + 1) = (x + 1)(x – 1) So for this curve, when x = 0, y = -1 It therefore crosses at y = -1 y g(x) g(x + 1) x 2 0 1 -1 -1 x’s replaced with ‘x + 1’ 4E
Sketching Curves h(x) + 1 More Transformations Given that: i) h(x) = 1/x Sketch the curve where y = h(x) + 1. State any locations where the graphs crosses the axes and the equations of any asymptotes. h(x) is a positive reciprocal graph h(x) = 1/x h(x) + 1 = 1/x + 1 The asymptotes are: x = 0 (the y-axis) y = 1 It will cross the x-axis at -1 since this value will make the equation = 0 y 1 h(x) -1 x 4E
Sketching Curves Even more Transformations You also need to be able to perform transformations of the form: this is a horizontal stretch of 1/a. You also need to know: this is a vertical stretch by factor ‘a’ ‘We will get the same y values, using half the x values’ This is because the x values get multiplied by 2 before the y values are worked out ‘We will get y values twice as big, using the same x values’ This is because when we work out the y values, they are doubled after 4F
Sketching Curves y f(x) Even more Transformations Given that f(x) = 9 – x2, sketch the curve with equation; a) y = f(2x) Sketch the original curve, working out key points. If x = 0 If y = 0 9 x -3 3 (0,9) (3,0) (-3,0) 4F
Sketching Curves y f(x) Even more Transformations Given that f(x) = 9 – x2, sketch the curve with equation; a) y = f(2x) Substitute ‘2x’ in place of ‘x’ If x = 0 If y = 0 9 x -3 3 y f(2x) 9 (0,9) x -1.5 1.5 (-1.5,0) (1.5,0) 4F
Sketching Curves y f(x) Even more Transformations Given that f(x) = 9 – x2, sketch the curve with equation; a) y = 2f(x) f(x), the original equation, is doubled.. If x = 0 If y = 0 9 x -3 3 18 y 2f(x) (0,18) x -3 3 (3,0) (-3,0) 4F
Summary • We have learnt the shapes of several different curves • We have learnt how to apply transformations to those curves • We have also looked at how to work out the ‘key points’