Download
1 / 14
150 likes | 404 Views
Cavitation Intensity Measured on a NACA0015 Hydrofoil with Various Gas Contents. Project scope. Jarle Vikør Ekanger, MSc in Process Engineering Currently : Product Engineer in FDB & PhD Candidate (NTNU); «Water Quality in a hydropower context» (2011-2014 )

E N D
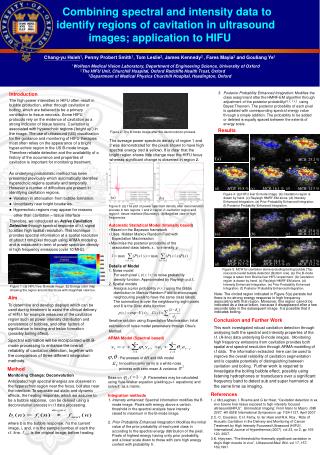
Cavitation Intensity Measured on a NACA0015 Hydrofoilwith Various Gas Contents
Project scope • Jarle Vikør Ekanger, MSc in Process Engineering • Currently: Product Engineer in FDB & PhD Candidate (NTNU); «Water Quality in a hydropower context» (2011-2014) • Industrial PhD, partly funded by the Norwegian Research Council.
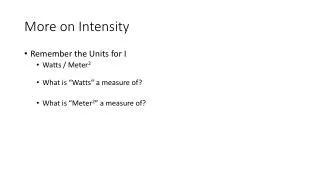
Objective • Detect variation of cavitation intensity for a wide variety of cavitation types (i.e cavitation numbers), due to changed water quality. • Verification of cavitation detection using external sensors. • Use frequency spectrum analysis and amplitude demodulation to determine (relative) cavitation intensity.
Experimental setup • 3 x B & K 4397 Accelerometers • Uniaxial, fc = 25kHz • 1 x PAC R6α Acoustic Emission Sensor • fc = 60 kHz • All mounted externally Acc. mounted along each geometrical axis on a rod extedended from the foil base mounting plate. Pic before AE sensor move. AE sensor moved to here after initial tests
Recording signals • Acoustic sensor and acceleremeter signals were recorded using cDAQ equipment from NI. Periods of 10s length were logged. • Test section static pressure, test section water velocity, water gas content and water temperature was logged separately, using the water tunnel proprietary system.
Finding evidence of cavitation • Collapse of cavitation bubbles is associated with high frequency vibrations and acoustics. • Frequency analysis of the measurement data to detect increased high frequency activity. • The layout of the water tunnel allows visual evaluation of cavitation activity level. • I.e: We had cases that were considered cavitation free by visual inspection. • Comparison of cavitating and non-cavitating cases provide frequency bands that are assumed to hold the cavitation noise.
Cavitation frequency band • (Presumed) Cavitation free signal compared to signal with cavitation. Both signals to same axis scale. • 45kHz to 55kHz appear to hold cavitation noise, but there is a general increase of energy in the entire spectrum!
Cavitation frequency band • Scaling the presumed cavitation free signal (new axis on the right), reveals shape similarity between the signals. • Suggests that a small amount of cavitation is present, but not visually detectable in the presumed cavitation free case.
Confirming cavitation by amplitude demodulation • In the presence of local pressure variations, cavitation activity should be seen to fluctuate. • Examples: Vortex shedding from a hydrofoil, guide vanes in pumps and turbines, penstock dynamics. • Matching amplitude modulation frequencies to hydrodynamic frequencies present in the system provide basis for further analysis.
Demodulation analysis • A(t) = abs{fbandpassfilter(t) + i * Hilbert[fbandpassfilter (t)]} • Frequency analysis of A(t) will reveal any dominant modulating frequencies. • Results did not show clear modulation frequencies. • Multiples of the pump frequency were found, should not be transferrable through the water. • It was concluded that intensity variations could not be verified. • Further analysis: Crest Factor
Crest factor • Used an algorithm to find the peak amplitude values corresponding to discrete bubble collapses • Averaged peak values relative to the cases identified as cavitation free were plotted against cavitation number.
Conclusion • Expected intensity modulation effect from vortex shedding could not be verified. • Crest Factor analysis confirms that cavitation noise is affected by the gas content in the water. • This is caused by air content variations in the bubbles at different dissolved gas pressures.
Special thanks to: • Roger E.A Arndt • For providing access to the SAFL cavitation tunnel • Ellison Kawakami • For providing operational assistance at the SAFL cavitation tunnel • Xavier Escaler • For good discussions and assistance on analysis.