Download
1 / 27
270 likes | 540 Views
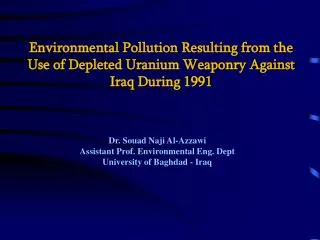
Dr. Souad Naji Al-Azzawi Assistant Prof. Environmental Eng. Dept University of Baghdad - Iraq. Environmental Pollution Resulting from the Use of Depleted Uranium Weaponry Against Iraq During 1991.

E N D
Dr. Souad Naji Al-Azzawi Assistant Prof. Environmental Eng. Dept University of Baghdad - Iraq Environmental Pollution Resulting from the Use of Depleted Uranium Weaponry Against Iraq During 1991
During the aggression of 1991, the United States and its allies used a new generation of radiological weapons on Iraq… • Airforce A-10 aircraft fired about 940,000 30 mm rounds of DU during the war. • The weight of each penetrator is 272 gm- hence, about 256 tons of DU were fired. • M1A1 tanks fired 120 mm rounds of 4.1 Kg each. • M1 and M60 tanks fired 105 mm rounds of 3.4 Kg each. • 14,000 DU tank rounds were fired. • 7,000 DU rounds were fired during training in Saudi Arabia. • 4,000 DU rounds were fired during combat. • 3,000 DU rounds were lost in fires and accidents. • A total of 600 – 800 tons of DU expenditures lay within Iraqi territory.
Table (1) shows the types of DU-related weaponry used in the 1991 aggression against Iraq:
Objectives of the Study… This research is part of a series of researches conducted to define environmental pollution and damage resulting from the use of DU weaponry in Iraq. The following measurements were conducted during 1995 – 1996 in southern Iraq, where DU weapons were heavily used: 1- Measuring the increase in radioactivity through field investigation and detection. 2- Environmental sampling of soil, surface and ground water, plants and animal tissues related to the food chain. 3- Laboratory testing and analysis. 4- Modeling radiological contamination through environmental pathways to the human body and population in the study area. 5- Defining the whole body dose the people of Al-Basrah and the troops were exposed to during 1991 and the following years. This lecture will deal with points 1, 2 and 3 only…
The Study Area… • The study areas are mainly suburbs of Al-Basrah city, where depleted uranium weapons were used extensively. The selected study areas were: • Jabal Sanam • Safwan • Al-Zubair • Northern Rumaila Oil Fields • Southern Rumaila Oil Fields
Field and Laboratory Work… Six researchers and 14 assistants conducted the following research: 1- Full investigation to define geology, topography, hydrology and hydrogeology, geomorphology, soil condition, climatology, vegetation cover, and wild life status in the area. 2- Radiological detection to define the gamma radiation exposure using portable scintillation counters. 3- Soil sampling from high exposure rate areas. Samples from areas where 13 destroyed tanks and four armored vehicles were also collected. Six to eight soil samples were reclaimed from and around each destroyed target at different depths. 4- Surface water samples from waterways and wadies were reclaimed and also groundwater samples from existing deep wells in the area. Bottom sediments from nearby channels were also collected. 5- Biotic samples of wild plants, vegetables and different kinds of meat (fish, sheep, cows) were also collected.
Movement and Direction of Sandstorms in the Study Area Frequency and Wind Speed of Study Area
Sampling Scheme from Areas of Destroyed Targets by DU Weapons Sample Depth (cm) X1 0 – 5 X21 0 – 5 X22 5 – 15 X23 15 – 30 X3 0 – 5 X4 0 – 5
Types of measure or sample No. Exposure Rate Samples 124 Soil Samples 124 Ground and Surface Water Samples 58 Biosphere Samples 154 Table (2) shows the number and types of samples that were collected from the area: Important Notes: • Exposure measurements and environmental sampling were all done according to IAEA standard methods. • Laboratory tests were done using a high purity Germanium analyzer from the Iraqi Atomic Energy Organization’s environmental laboratories. The following tables show the results of the soil, water and biotic sampling program…
Selected Higher Concentration of Radionuclides in Water and Water Sediments
Selected Higher Concentrations of Radionuclides in Plant and Animal Tissues
Results and Conclusions… The following table shows the natural radiation background levels of the measured radioisotopes in the study area from the previous studies.
High exposure rates of gamma radiation were detected in the areas of destroyed tanks and armored vehicles. The increase in the exposure rates ranged between 8 – 184 μR/hr. The background exposure level in the study area is 6 – 7 μR/hr. • The highest exposure rates were recorded in the Jabal Sanam area, Southern Rumaila Oil Fields and Northern Rumaila Oil Fields in that order. Safwan and Al-Zubair measurements indicated slight increases of exposure in correlation to background levels. Destroyed artilleries were removed from these areas without any signs or indicators of where they had been. The limited exploration and sampling program is the major cause of poor detection in these areas.
Soil sample laboratory tests proved high activity concentrations of U-235 and U-238 measured as Th-234. Activity concentration measurements of U-235 in soil samples from contaminated areas of destroyed tanks and vehicles ranged from 60 – 1050 Bq/Kg. For Th-234, the range was 237 – 65,200 Bq/Kg. • The highest activity concentrations were measured from soil samples 0.1 m away from the targets. Surface soil recorded higher U-235, U-238 activity levels than samples from 5 – 15, or 15 – 30 cm deep. High activity levels were also recorded for soil or dust reclaimed from inside the tanks.
The activity concentration ratios of U-235/U-238 range between 0.003 – 0.0327 which are less than 0.046. This proves that this activity results from DU radioisotopes and not from natural radiation activity. • Since dominant wind and sandstorm direction is north-west south-east most of the contaminants were transported back to Kuwait and Saudi Arabia. • No radiological activity could be detected in surface and ground water samples collected from the area. Sediments from channels and wadies in the area showed 2 – 3 fold increase in radioactivity. • High Th-234 activity concentrations were detected in four samples of wild plants (Haloxylon Salicornicum and Stippa Capenisis) that were close to one of the destroyed tanks in Jabal Sanam and the Southern Rumaila Oil Fields.
Conceptual Model of the Radioactive Mass Distribution in Environ. Pathways from One Destroyed Tank by D.U.
In phase 2 of this research, the following was done: 1- Modeling of DU-related radioisotopes transport and spreading from 5,724 contaminated destroyed target to the surrounding areas, and the definition of their concentrations in: air, water, soil, vegetation cover of the previous figure. 2- Use of reverse analysis to define DU radionuclides concentrations in 1991 and the following years instead of 1996 only. 3- The prediction of total contaminated soil areas, water and water sediments, vegetation cover for the period of 1991 – 1996. The areas were categorized as either high, medium or low contamination. Results of DU contamination modeling is shown in the table…