Download
1 / 13
130 likes | 268 Views
Relationship between spectral particulate attenuation and particle size distribution. Peng Wang. Introduction:. Particle Size Distribution (PSD): Information about the ecological dynamics of marine water, particulate sedimentation fluxes and sediment transport;

E N D
Relationship between spectral particulate attenuation and particle size distribution Peng Wang
Introduction: • Particle Size Distribution (PSD): Information about the ecological dynamics of marine water, particulate sedimentation fluxes and sediment transport; • Beam attenuation coefficient (C): Quantify light propagation in the ocean and to study the concentration of the material affecting light propagation.
PSDs could be well approximated by a hyperbolic (Junge-like) distribution :N(D) = N0(D/D0)-ξ • N(D): the number of particles with diameters between D and D+dD divided by dD; • D0: reference diameter; • ξ: PSD slope varying between 3 and 5.
The particulate attenuation cp:cp(λ) = cp(λ0) λ-γ The exponent of the particulate attenuation spectrum (γ) and the exponent of the PSD (ξ) are linearly by γ = ξ – 3 ([Diehl and Haardt, 1980]); The main goal of this study is to test that relationship.
Methods: Cp Cp = Cpg – Cg
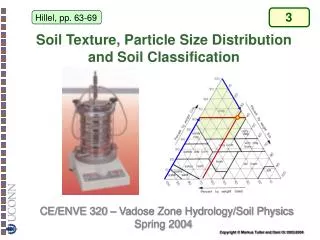
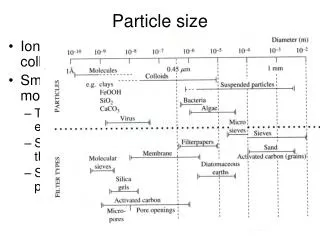
PSDs: Coulter Counter 3-10 um range used: avoid noise in the small size range (2<D<3um); the scarcity of particles >10 um made statistical very bad.
Results: • Optical Data: Cruise:CD Cruise:AB
Comparison: ξ for Two Different Particle Size Ranges and Spectral Slope γ
Conclusions: • The shapes of the particulate attenuation spectra (cp(λ)) were found to be well approximated by a power law with respect to wavelength; • A single Junge exponent was found not to match very well the whole data from 2 to 10 um; a better fit was found when the size range was limited to 3 < D < 10um; • The range of observed values of ξ and γ is relatively consistent with the linear relationship: γ = ξ – 3 .