Download
1 / 47
470 likes | 588 Views
TELE NORTE LESTE PARTICIPAÇÕES S.A. June, 2002. Consolidated figures except where noted. Overview. Largest Telco in Latin America: 17.7 million lines installed 14.8 million lines in service Concession Area: 65% of Brazilian Territory (16 states)

E N D
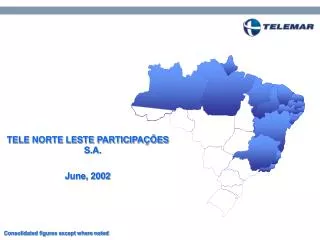
TELE NORTE LESTE PARTICIPAÇÕES S.A. June, 2002 Consolidated figures except where noted
Overview • Largest Telco in Latin America: 17.7 million lines installed 14.8 million lines in service • Concession Area: 65% of Brazilian Territory (16 states) Pop: 93 Million (54% of Country´s total) 40% of Country’s GDP Over 21 Million Households • Tele Density: 16% ( vs. 22% National Average) • TNLP4: Heaviest Weighted Stock in IBOVESPA • Free Float: 79% of Total Shares • Level 2 ADR (NYSE:TNE): 28% of Total Shares (May/02) • Market Value: US$ 4.9 billion (May/02) • Investment grade rating: Fitch / BBB- Moody´s / Baa3 S&P / brAA+
Corporate Structure TELEMAR PARTICIPAÇÕES S.A Free Float 18.8% 78.9% TELE NORTE LESTE PARTICIPAÇÕES S.A 2.3% Treasury 79.6% HICORP OUTSOURCING TNL PCS TELEMAR Norte Leste TNL ACESSO CONTAX TNEXT Regional Branches Pernambuco Bahia Alagoas Piauí Pará Roraima Espírito Santo Rio de Janeiro Minas Gerais Amazonas Sergipe Rio Grande do Norte Ceará Maranhão Amapá Paraíba
Shareholders’ Structure (After new issue) Capital R$ 4,476,809,955.27 Total Shares: 383,846 mn Preferred: 255,897 mn Common: 127,949 mn TOTAL CAPITAL BNDESPar Fiago AG Telecom ASSECA Participações Lexpart Part. L. F. Tel BrasilCap BrasilVeículos 25.0% 19.9% 11.3% 11.3% 11.3% 11.3% 5.0% 5.0% Preferred Shares -------96.4% Brazil ------------------- 54.0% ADR ---------------------42.4% Common Shares ------- 43.8% 18.8% 78.9% Free Float TELEMAR * PARTICIPAÇÕES S.A. Shares in Treasury = 2.3% Tele Norte Leste Participações S.A. (TNE) *53.0% of TNE´s common shares
Senior Management - TNE TELE NORTE LESTE Board of Directors Chairman – Fersen Lambranho Tele Norte Leste José Pauletti Oi Luiz Eduardo Falco Contax James Meaney CFO Alvaro dos Santos Telemar Norte Leste Ronaldo Iabrudi
Dividend Payments 1998/2001 (R$ Mn) • R$ per 000 Shares • 0.67 • 0.67 • 00 0.67 • 01 0.81 800.000 700.000 600.000 500.000 400.000 300.000 200.000 100.000
92% 92% 89% 84% 82% 2000 2001 2002E 1999 1Q02 17.7 18.0 20,0 14.8 14.8 15 12.8 11.8 10.5 9.7 8.8 10 8.1 7.8 7.2 5 0 Jul-98 1998 1999 2000 2001 1Q02 2002E Network Expansion Utilization Rate (%) 1998 20 18.1 Lines in Service Lines Installed (in mn) Digitalization Rate
Employee Productivity - Wireline ( LIS/ Employees)
Revenue Growth - 1998/2001 (R$ Mn) +97% (CAGR: 25.3)
Gross Revenue Growth (Quarterly) (R$ Mn) 4Q 3Q 2Q 1Q02 +20.4% (yoy) 1Q
Gross Revenue: Breakdown per Service (R$ Mn) 3,121 3,286 3,570 3,684 3,759 1Q01 2Q01 3Q01 4Q01 1Q02
Revenue per Employee* CAGR: 44.8%** (*) Gross Revenue / Full-time wireline employees (R$ 000/year) (**) Annualized 1Q02 ratio
Local Service – Quarterly Growth 32% (yoy) 24% (yoy) Gross Revenue (R$ Million)
Long Distance Revenue - Quarterly Growth 32% (yoy) 23% (yoy) Gross Revenue (R$ Million)
Data Transmission Revenue - Quarterly Growth 3% (yoy) 36% (yoy) Gross Revenue (R$ Million)
Network Usage Revenue – Quarterly Growth 19% (yoy) 22% (yoy) Gross Revenue (R$ Million)
Net Revenue - Quarterly Growth (R$ Mn) 21% yoy 26% yoy
Operating Expense Breakdown (R$ Mn) 2,197 1,838 1,372 1,399 1,230 % s
Operating Expense Breakdown - (R$ Mn) (excluding interconnection costs) 1,528 1,266 785 825 710 %
Cost of Services Provided (excluding interconnection costs, depreciation, & amortization) (R$ Mn)
Interconnection Costs (R$ Mn)
Selling Expenses (R$ Mn)
G&A Expenses (R$ Mn)
Line Blockage (In Thousands) 47% 39% 61% 53% * End of Period % of Total Lines in Service Partial Blockage (outgoing calls): 30 days past due Total Blockage (all calls): 60 days past due Disconnection: 90 days past due
EBITDA (Quarterly) (R$ Mn) 4Q 3Q 2Q 1Q02 +31.2% (yoy) 1Q
Consolidated Income Statement One Time Charge Expenses recovery (SISTEL)
Consolidated Balance Sheet (R$ Mn)
Debt Structure – 31/03/02 LT DEBT 2002 12% 2006 and beyond 2003 42% R$ mn 12% 2004 17% ST 1,424 Cash 1,044 2005 17% • DEBT PROFILE • R$ 5,824 million foreign currency (62%)*: • LIBOR + 6% p.a. • R$ 3,537 million in Brazilian currency (38%): • (+ 17% p.a.) Net Debt 8,317 Long Term 7,937 TOTAL = 9,361 * 90% Hedged
CAPEX – Quarterly Figures (R$ Bn)
CAPEX & Net Revenue – 1998/2002E 99.6% 34.5% 48.5% 36.1% 15.8% (R$ Millions) Capex / Net Revenue
TNE – PCS ´´Oi´´ - Current Status • Acquisition of PCS license for Region I (March/2001); US$ 1.4 billion credit (suppliers and bank facilities); Launching of the brand name (Jan/02); Ready to launch (April/02); 14 Metropolitans areas (16 Dec/02E) – 200 cities (285 Dec/02E) with 40 million inhabitants (48 million Dec/02E); Main Suppliers: Nokia, Alcatel, Siemens; Distribution channels = over 1,326 point of sales; Site integrates 1,713 (2,600 Dec/02E); Employees: 622 (880 Dec/02E); 4,000,000 pre-subscribers (June/02); 46 International roaming signed (100 Dec/02E); Technology GSM/GPRS - in all Capitals; Operating Agreement Infrastructure Co-siting Interconnection Roaming International Operating Synergies Billing & Credit Infrastructure & BackOffice Data Base
New Businesses Adding Value • Internet Access • National & International Long Distance Calls • Data Business Region I Brazil Outgoing Calls* USA – 34% Japan – 11% Italy – 9% Portugal – 8% Region II Outgoing Calls Incoming Calls International Calls Region III * Source: LatinPanel – 05/05/02
OUTLOOK 2002 • Revenue Drivers: - Rate increase - Platform in service growth - New Services – National and International LD and Data - New Markets – Corporate (Regions 2 and 3) - Improve ARPU Launching ofPCS – June; Cost Drivers: - Increase operating efficiencies; - Headcount reduction; - Maintenance costs reduction; - Bad debt control CAPEX reduction; Net Debt under control.
Lines in Service by year end 14.8 11.8 9.7 7.8 1998 1999 2000 2001 2002 Revenue Drivers Platform Expansion (mn) 15.6/15.8 Average Lines in Service 15.2/15.3 13.6 10.6 8.6 7.2 1998 1999 2000 2001 2002
Cost Drivers • Headcount Reduction - 40% in average 3rd Party services reduction (as a % of net revenue) Bad debt control - less than 5% of Gross Revenue (in average)Marketing expenses• wireline (30% reduction)•wireless (partially deferred)
Capex 10.1 2.8 2.5 2.5 2.2 1998 1999 2000 2001 2002 2002/2001 - CAPEX Reduction - TNE 2001 10.1 R$ bn* 2002 2.5 R$ bn -75% Wireline Business Wireless Business * Includes carryover effects (4Q01)
Industry Outlook Annual Growth 7.7% Annual Growth 6.5% Annual Growth 2.4% Source: Yankee Group
“SAFE HARBOR” STATEMENT This presentation contains forward-looking statements. Statements that are not historical facts, including statements about our beliefs and expectations, are forward-looking statements and involve inherent risks and uncertainties. These statements are based on current plans, estimates and projections, and therefore you should not place undue reliance on them. Forward-looking statements speak only as of the date they are made, and we undertake no obligation to update publicly any of them in light of new information or future events. Investor Relations Rua Humberto de Campos, 425 / 8º andar Leblon Rio de Janeiro -RJ Phone: ( 55 21) 3131-1314/1315/1313 Fax: (55 21) 3131-1325/ 3131-1326 E-mail: invest@telemar.com.br Visit our new website: http://www.telemar.com.br/ri