Download
1 / 23
230 likes | 365 Views
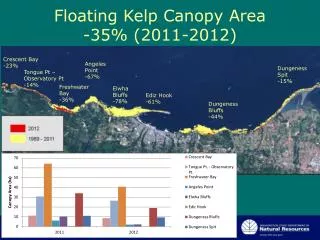
Floating Kelp Canopy Area -35% (2011-2012). Crescent Bay -23%. Angeles Point -67%. Dungeness Spit -15%. Tongue Pt – Observatory Pt -14%. Freshwater Bay -36%. Elwha Bluffs -78%. Ediz Hook -61%. Dungeness Bluffs -44%. After - 2012. Before - 2010.

E N D
Floating Kelp Canopy Area-35% (2011-2012) Crescent Bay -23% Angeles Point -67% Dungeness Spit -15% Tongue Pt – Observatory Pt -14% Freshwater Bay -36% Elwha Bluffs -78% Ediz Hook -61% Dungeness Bluffs -44%
After - 2012 Before - 2010 Directly east of the Elwha River mouth, -8 m (MLLW).
Tran 1 .94 .06 .80 Tran 2 .80 .42 .48 Tran 3 .66 .40 Tran 4 .90 .48 1 2 Tran 5 3 .78 .64 5 4
Changes in Kelp Near the Elwha River Preliminary Results After Dam 1989-2010 (DNR) Helen Berry DNR Nearshore Habitat Program
Acknowledgements • 2010 underwater videography • Cathy Lear, Clallam County • Jim Norris, Marine Resource Consultants • Floating kelp data collection and mapping • Bob VanWagenon, Ecoscan • Discussion • Tom Mumford, Marine Agronomics
Final EIS prediction… From the U.S. Department of the Interior. 2006. Elwha River Ecosystem Restoration Final Environmental Impact Statement. http://www.nps.gov/olym/naturescience/upload/ElwhaFinalEIS2.pdf
Impacts of Sedimentation on Kelp • Burial/Scour • Damages living plants, decreases hard substrate availability • Silt • Prevents adhesion of gametophytes • Water column turbidity • Decreases available light
Kelp = Large Brown Algae in the Order Laminariales, Phylum Ochrophyta (Phaeophyta) Floating or Canopy-forming Source: Mumford (2007) Kelp and Eelgrass in Puget Sound
Kelp = Large Brown Algae in the Order Laminariales, Phylum Ochrophyta (Phaeophyta) Jim Norris Stipitate Sandra Lindstrom Source: Mumford (2007) Kelp and Eelgrass in Puget Sound
Kelp = Large Brown Algae in the Order Laminariales, Phylum Ochrophyta (Phaeophyta) Prostrate Source: Mumford (2007) Kelp and Eelgrass in Puget Sound
Kelp = Large Brown Algae in the Order Laminariales, Phylum Ochrophyta (Phaeophyta) Source: Mumford (2007) Kelp and Eelgrass in Puget Sound
Floating Kelp Monitoring Methods (Since 1989) Near-vertical aerial photography collected from small plane during a late summer low tide (7500’ MSL) with Nikon D200 digital 35mm DSLR camera. Hand delineated onto 1:12K basemaps
Floating Kelp Canopy Area: WA Outer Coast and Strait of Juan De Fuca Slope = 61.5 ha/yr P-value = 0.0002 Canopy Area (hectares) Slope = 34.9 ha/yr P-value = 0.03 Slope = 25.1 ha/yr P-value = 0.0005
Floating Kelp Canopy Area: WA Outer Coast and Strait of Juan De Fuca Hectares El Niño-Warm Dry- low upwelling Climate Index La Niña- Cold Wet Canopy Area (Hectares) DNR’s Nearshore Monitoring Program
Trends in Kelp Canopy Area by Section (1989-2010) Eastern Strait – comparatively little kelp, fewest increasing sections, predominantly Nereocystis. Western Strait – most increasing sections, most kelp area overall, most consistent year-to-year. Outer Coast – increasing in many sections, extremes in year-to-year changes.
Elwha River Canopy-forming Kelp Before Dam Construction 1912 (Rigg) Pre-dam (1911-1912) After Dam Construction 1989-2010 (DNR) Present (1989-2004)
Transects Surveyed in 2010 (before)* and 2012 (after) - shallow subtidal to -15 m * Thanks to Clallam County (Cathy Lear) and MRC (Jim Norris) for this imagery.
Classification Categories • Vegetation Types • All macrovegetation • Stipitate kelp • Prostrate kelp • Floating kelp • Non-kelp red/brown algae • Green algae • Seagrass • Cover classes • Low <33% • Medium 33-66% • High > 66% Caveats: multiple canopies, what’s ‘living’?, more cover categories would be nice. Mapping Unit ~ 1 m2
1.0 .82 .99 .94 1 1.0 .97 2 1.0 1.0 3 .95 .88 1 4 2 3 .99 .97 5 4 5
.66 .36 .40 .50 .27 .30 .27 .25 .23 .17 1 2 3 .38 5 .30 4
Next Steps • More data analysis to characterize changes in kelp (comparison across areas and depth ranges). • Next round of data collection in late summer 2013.