Download
1 / 33
330 likes | 350 Views
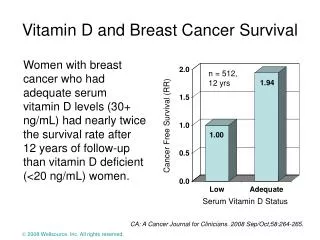
This study explores the spatial patterns of survival in breast and prostate cancer in Michigan. The analysis aims to identify factors influencing stage at diagnosis and survival rates once diagnosed. Various statistical measures and analytic approaches are used to analyze the data.

E N D
Detecting Significant Spatial Patterns of Survival from Breast and Prostate Cancer in Michigan Glenn Copeland1, Jaymie Meliker2,3, May Yassine4 1 Michigan Cancer Surveillance Program, Lansing, MI 2 BioMedware, Inc., Ann Arbor, MI 3 Graduate Program in Public Health, Department of Preventive Medicine, Stony Brook University (SUNY), Stony Brook, NY 4 Michigan Public Health Institute, Okemos, MI Denver, CO NAACCR June 12th, 2008
Con Effort and Dollars No Denominators Difficult to Analyze Can Easily Mislead Confidentiality Disconnect with Causation Pro Corrects Residence Identifies Census Tract Enables Mapping Really Sells! Tool for Cluster Studies Geocoding of Cancers - Issues
Eureka Moment • Study Proposal • Examine Association of Arsenic in Groundwater and Bladder Cancer • Collaborative between • U of Michigan • David Schottenfeld, Jerome Nriagu, Jaymie Meliker • BioMedware • Geoffery Jacquez, Pierre Goovaerts • Complex Study Design • Establish Connection between Exposure and Cancer • Exposed to Broader View of Geospatial Analysis • Merging of Analytical and Spatial Tools • STIS - Space-Time Intelligence System
Mean Arsenic (ug/L) Upper Bound No Data < 10 10 - 20 20-30 30-40 40-50 ≥ 50 Naturally Occurring Arsenic in Groundwater
Perhaps in place of slide #4? Arsenic in Public Water Supplies 50 40 30 20 10 0 µg/L
Collaborate with BioMedware • Turn Focus from Cluster to Control • Address Denominator Problem • Develop Measures (largely) Immune from Reporting Issue • Resolve Disconnect between Cause/Effect and Geographic Association with Outcome
Easily communicate trends and differences across regions • Identify patterns and factors potentially contributing to those patterns • Most efforts have sought to address etiologic questions • Given latency concerns, we set out to explore spatial pattern to help understand more immediate factors that might influence stage at diagnosis and survival once diagnosed
Why statistically analyze disease patterns? • Human tendency to see patterns/clusters where they may not exist • Can lead to false positives – raise inappropriate concern
In 2004 a decade-old grilled cheese sandwich said to bear an image of the Virgin Mary sold on eBay for $28,000 Courtesy G. Jacquez
The “Nun Bun”, from the Bongo Java coffee shop in Nashville, Tennessee (Owner Bob Bernstein) Source: Prof. John K. Kruschke, http://www.indiana.edu/~jkkteach/P335/nunbun.html Courtesy G. Jacquez
The 'Face on Mars' taken by the Viking 1 orbiter and released by NASA/JPL on July 25, 1976. Black dots denote data errors Courtesy G. Jacquez
Select Statistical Measures • Denominator within the Registry • Less Subject to Reporting Bias • Meaning to Cancer Control • Survival Rates • Percent Early Stage • Percent Late Stage
Data • Cases of Breast and Prostate Cancer from 1985 to 2002 • Cancer cases were defined as early stage, late stage, or unknown using the SEER General Summary Stage classification • Early stage consisted of local and in situ cases; late stage consisted of regional and distant metastatic cancer • Cases with unknown stage of diagnosis were not included in the analysis (<5%) • Approximately 92% of breast and 90% of prostate cancer cases were successfully geocoded to residence at time of diagnosis • Breast cancer • 72,216 early stage cases; 29,202 late stage cases • 87,807 survived 5+ years; 13,611 not survive 5+ years • Prostate cancer • 79,661 early stage cases; 19,544 late stage cases • 76,639 survived 5+ years; 22,566 not survive 5+ years • The percentage of addresses successfully geocoded did not differ by stage, survival, or year of diagnosis • Use state legislative districts for presenting results compelling to legislators • Maps and analyses performed with Space-Time Information System software (STISTM, TerraSeer, Ann Arbor, Michigan) and SatScanTM
Analytic Approaches Considered • Examine trends using aggregated data in polygons • Trends observed--but are arbitrary polygon shapes influencing the results? • Compare point data with aggregated data • Compare SatScan vs Nearest Neighbor methods for analyzing point data
Disparity in Early Stage – Prostate Cancer Detroit Neighborhoods 1995-2003
Breast Cancer Survival (5+ Years) Proportion Survived (quintiles) 9-Year moving windows Improvements over time clearly demonstrated
Prostate Cancer Survival (5+ Years) Proportion Survived (quintiles) 9-Year moving windows Improvements over time clearly demonstrated
Analytic Approaches Considered • Examine trends using aggregated data in polygons • Trends observed--but are arbitrary polygon shapes influencing the results? • Compare spatial clustering analyses of point data vs. aggregated data • Compare SatScan vs Nearest Neighbor methods for analyzing point data
Clusters of Early Stage Breast Cancer Cases 1994-2002 • SatScan spatial clustering approach • Considered current state-of-the art method for analyzing aggregated data • Points, polygons of census tracts and State House Legislative Districts • Significant results only detected using point data • Plausible because of ecologic fallacy and modifiable area unit problem (MAUP) Methods description: Bernoulli model run on point data, Poisson model on polygon data; search window equivalent to 4% of population (more than twice as large as the largest house polygon, 8 times as large as largest tract polygon). No pairs of centers both in each other's cluster. Purely spatial analysis. 999 replicates. Circular window. Took more than 9 hours to run SatScan on the point dataset.
Analytic Approaches Considered • Examine trends using aggregated data in polygons • Trends observed--but are arbitrary polygon shapes influencing the results? • Compare results of point data with aggregated data • Point data appear more sensitive (not surprisingly) • Compare SatScan vs Nearest Neighbor methods for analyzing point data
What is the most appropriate method for identifying clusters in point data? • We compared two most common methods • SatScan • Circular scan window of varying diameter • Takes many hours to run on 50,000+ points • Cuzick-Edwards Test • Nearest neighbor approach • Quick (only a few minutes) • Must repeat analyses across different numbers of nearest neighbors (k) to identify consistency
Clusters of Early Stage Breast Cancer Cases 2000-2002 • Limited to only 3 years of data because of speed of analysis in SatScan • Clusters (shown in blue) identified using Cuzick-Edwards • K = 200 nearest neighbors (~1% of total sample size) • No clusters identified with SatScan • Which method is correct?
Evaluating Cuzick-Edwards Results • Are clusters of early stage cases associated with known risk factors? • Yes! • Fully adjusted logistic regression models • Odds of being in early stage breast cancer cluster • Proximity to mammography clinics: as distance increases by 5 km: OR=0.93; CI (0.90, 0.95) • % Poverty in 2000 Census Tracts: as % poverty increases by 1%: OR=0.92; CI (0.91, 0.93) • Race: if black, compared with white: OR=0.47; CI (0.39, 0.56) • Simulation results also encouraging • Not presented today
Risk Estimates from Cuzick-Edwards Test: Influence of Choice of k Nearest Neighbors Proportion Surviving at least 5 Years in k Nearest Neighbor Windows k=100 k=200 k=300 Upper 5% of data Next 20% Middle 50% Next 20% Bottom 5% Choice of k does not meaningfully influence the results
Analytic Approaches Considered • Examine trends using aggregated data in polygons • Trends observed--but are arbitrary polygon shapes influencing the results? • Compare results of point data with aggregated data • Point data appear more sensitive (not surprisingly) • Compare SatScan vs Nearest Neighbor methods for analyzing point data • Nearest neighbor approach looks most promising (Cuzick-Edwards clustering method)
Early Stage Breast Cancer: Time Series 1985-87 1992-94 2000-02 Upper 5% of data Next 20% Middle 50% Next 20% Bottom 5%
Breast Cancer 5 Year Survival: Time Series 1985-87 1992-94 2000-02 Upper 5% of data Next 20% Middle 50% Next 20% Bottom 5%
Early Stage Diagnosis (Left) and 5 Year Survival (Right): Breast Cancer, 1985-87 Early Stage Breast Cancer, 1985-1987 Breast Cancer 5 Yr Survival, 1985-1987 Highest proportion* Lowest proportion* Highest proportion* Lowest proportion* *proportion of nearest 200 neighbors (blue=top 5%, red= bottom 5%)
Early Stage Diagnosis (Left) and 5 Year Survival (Right): Breast Cancer, 1992-94 Early Stage Breast Cancer, 1992-1994 Breast Cancer 5 Yr Survival, 1992-1994 Highest proportion* Lowest proportion* Highest proportion* Lowest proportion* *proportion of nearest 200 neighbors (blue=top 5%, red= bottom 5%)
Early Stage Diagnosis (Left) and 5 Year Survival (Right): Breast Cancer, 2000-02 Early Stage Breast Cancer, 2000-2002 Breast Cancer 5 Yr Survival, 2000-2002 Highest proportion* Lowest proportion* Highest proportion* Lowest proportion* *proportion of nearest 200 neighbors (blue=top 5%, red= bottom 5%)
Summary • Spatial analyses of point data are more sensitive than analyses relying on data aggregated into polygons • In point data analyses, Cuzick-Edwards’ Test is more sensitive than the SaTScan spatial scan statistic • The Cuzick-Edwards’ Test allowed identification of an association between early stage breast cancer and proximity to mammography clinics, helping to justify this important public health measure • Methods were applied to identify clusters of early stage breast cancer through time, and also shown to be applicable for finding spatial patterns of survivors of breast cancer • The approaches outlined here should serve cancer control efforts • Application to other cancers • Enhancing the investigation of public health factors responsible for spatial patterns in cancer outcomes
Acknowledgments • NPCR funded the project • Redirected unobligated funds • We thank Geoffrey Jacquez, Pierre Goovaerts, and Gillian AvRuskin of BioMedware for their assistance with these maps and analyses • Terraseer.com