Advancing U.S. Hydropower: Strategies for Enhanced Performance and Value
150 likes | 270 Views
This report outlines the goals and technical approaches of the Hydropower Advancement Project (HAP), focusing on improving the performance and value of U.S. hydropower assets. Key objectives include increasing energy availability, identifying barriers, and prioritizing research needs. The project employs standardized assessment methodologies and promotes the dissemination of best practices. By characterizing the state of hydropower facilities, the HAP aims to enhance asset reliability and optimize operations while fostering stakeholder engagement and collaboration within the industry.

Advancing U.S. Hydropower: Strategies for Enhanced Performance and Value
E N D
Presentation Transcript
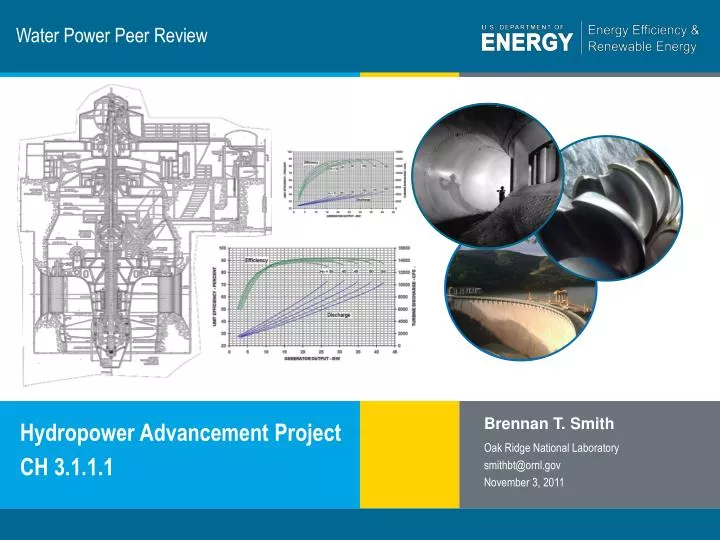
Water Power Peer Review Brennan T. Smith Oak Ridge National Laboratory smithbt@ornl.gov November 3, 2011 Hydropower Advancement Project CH 3.1.1.1
Purpose, Objectives, & Integration • HAP Vision • Accelerated Improvement of U.S. Hydropower Asset Performance and Value • Prioritized DOE Objectives for the HAP • Improved Estimate of Increased Energy Availability from US Hydropower Assets • Identification of barriers to increased energy availability • Identification of DOE Hydropower Technology Research Priorities for Improved Asset Performance and Value • Development and Dissemination of Best Practices, Assessment, and Analysis Tools to Maximize US Hydropower Asset Performance and Value
Technical Approach • High-Level Requirements for the HAP • Metrics and Targetsfor Hydropower Asset Condition and Performance • Standardized Assessment Methodology and Tools used by experienced hydropower professionals • Analyses and Trending of sampled facility results to characterize the state of the U.S. hydropower inventory • Stakeholder Acceptance of Targets, Metrics, and Methods • Key Concepts • Asset owners/operators are primary sources of quantitative and qualitative information used in the assessments. • Anonymous Aggregated Reporting enables individual facilities to compare their results to the collection of assessed facilities • No ranking of hydropower facilities!
Technical Approach – Roles Best Practices Catalog Drafts (Components) Assessment Manual Draft Component Condition Rating Workbooks Demonstration Assessments (Condition) Best Practices Catalog Drafts (Special) Performance Assessment Process Draft Plant UC/Load Allocation Calculator Demonstration Assessments (Performance) Request for Information to Hydropower Industry & Stakeholders Solicitation/Awards for Hydropower Facility Assessments Contract & Deliverable Management for Awardees
Technical Approach - Products . . . Phase II will produce reports that provide insight into the state of existing U.S. hydropower assets Phase I of the HAP will produce online documentation and tools to support the assessment process . . . Public Report of more than 50 Nationwide Assessments • Project configuration and assessment summaries • Overall and component-level trends in condition across many projects • Trends in water-use efficiency, constraints across many projects • Correlations between efficiency, condition, and production • Summary of opportunities for and barriers to upgrade/improvement Hydropower Technology Taxonomy Best Practices Catalog Under revision Non-Public Business-Sensitive Assessment Report Archive • Controlled by Non-Disclosure Agreements • Individual Project Performance and Condition Ratings • Project and Component Condition Database • Project Performance Database • Flow and Generation Data Assessment Manual • Process Guidance • Component Rating Workbooks • Performance Calculator Phase I Demonstration Assessment Reports • Center Hill • Rhodhiss • Flaming Gorge
Technical Approach Hydropower Technology Taxonomy • Provides physical and functional hierarchy for Best Practices, Ratings, and Component Condition Database • Standardization of scoring is key to meaningful analyses and trending • Provides consistent nomenclature for facility characterization, reporting and team/assessor communication • Color-coded to indicate HAP coverage and Corps/Reclamation HydroAMP alignment
Technical Approach Best Practices Catalog (BPC) • Concepts • Functional requirements • Typical configurations for components • Efficiency role of components • Reliability role of components • Concise history of technological evolution • State-of-the-art for components • Brief summary of component material and manufacturing constraints • Typical O&M requirements • References to testing protocols • Components covered • Turbines (Francis, Propeller, Pelton) • Generators • Conveyances • Main Transformers • Trash Racks • Instrumentation and controls for condition monitoring • Instrumentation and controls for automation • Special Topics • Uncontrolled water leakage • Flow releases • Operational impacts of environmental mitigation systems Condition Rating Workbooks • Excel Workbook files • User (assessor) fields to enter component scoring • Predefined rating scales for ease of use and consistency among different assessors • Automated roll-up with weighting factors from partscomponentsunitsfacility aggregate scores • Help files and field provide additional guidance • Components covered • Turbines (Francis, Propeller, Pelton) • Generators • Conveyances • Main Transformers • Trash Racks • Instrumentation and controls (condition monitoring and Automation) • Rating structure • Component specific weighting factors for parts (e.g. wicket gates, head cover, shaft, …) • Weighted scores for Age, Physical Condition, Technology Level, Operating Impact, and Maintenance Demands
Technical Approach HAP Performance Levels & Assessment Potential Performance Level (PPL) Turbine Component Example from Plant X Unit Y Installed Performance Level (IPL) Computationally engineered auto-aerating turbine 85% < h0 < 92% 1940’s Francis Technology Current Performance Level (CPL) 80% < h0 < 88% Upgrade Wear & Tear WQ Mitigation Retrofit with hub baffle aeration 75% < h0 < 85% What about performance in terms of reliability?
Technical Approach Performance Assessment Plant Performance Calculator Used to establish long-term (M>>8760) production potential baseline under assumption of flexible unit commitment, perfect dispatch, and scenarios of (installed, current, potential) unit efficiencies Currently Excel-based solver implementation, but will leverage Optimization Toolbox solver in the future.
Plan, Schedule, & Budget Schedule • Initiation date: March 2010 • Planned completion dates: • Phase I – Process Development – Dec 2011 • Phase II – Nationwide Assessments – Dec 2012 • Phase III – Upgrade Feasibility Studies – TBD, contingent on funding • Milestones: • Draft BPC and Assessment Manual – Sep 2011 (delayed, but near complete) • Demo Assessments at Center Hill and Rhodhiss - Field Reports Complete Sep 2011 • Flaming Gorge Demo Assessment delayed pending Reclamation approvals • Request for Info to Industry with BPC & Manual Publication – November 2011 • Assessment Team solicitation issued – February 2012 • Assessment Awards – April 2012 • Training Workshop – May 2012 • Assessments Completed – Sep 2012 • Analysis and Reporting – Dec 2012
Plan, Schedule, & Budget Phase I Phase I Phase II FY10-11 FY12 FY12 Expenditures Estimate Estimate ORNL $820K $125K $960K --Mesa $450K $500K* $220K --HPPi $125K $50K $130K --Sentech $404K $50K $50K Assessment Awards $2,500K TOTALS $1,799K $725K $3,860K TOTAL PHASE I & II FY10-FY12 $6,384K *includes Flaming Gorge Demo Estimate **USACE-Nashville and Duke Energy provided in-kind support to host Center Hill and Rhodhiss demos, respectively, and provided historical operations data.
Accomplishments and Results Center Hill Assessment Demonstration • FINDINGS: • Turbine Runners are candidates for rehabilitation or replacement. A more modern hydraulic design and improved methods of delivering aeration through the runner will provide significant efficiency improvements. • Wicket Gates, Stay Vanes, Spiral Case may yield efficiency improvements via surface rehabilitation and re-profiling. • Draft Tube may yield efficiency improvements from surfacing, shaping, and slot fillers. • Aging generator may see efficiency gain via air cooler and ventilation upgrades. • Improved shaft vibration sensing could improve bearing performance, reliability • 60 years of service through a personnel efforts to maintain the plant. 1950’s technology in general could be improved for better efficiency and reliability. • Awaiting hourly data from Corps for Performance Analysis • Condition Rating in Progress with updated HAP Tables
Accomplishments and Results Rhodhiss Assessment Demonstration • FINDINGS: • Improved hydraulic design and aeration through the turbine runner may provide significant efficiency improvements. • 86 year-old cast iron runners (Units 1 and 3) are expected to be at the end of their service life, and are candidates for replacement. • Stay vanes may see efficiency improvement via surface rehabilitation and re-profiling. • Some efficiency improvements from draft tube modifications, but slot fillers are not applicable (no gates) • 1920’s technology (e.g. cast iron runners) still in use--opportunities at Rhodhiss to use updated technology to not only improve unit efficiency and performance but also reliability. • Performance Analysis in progress • Condition Rating in Progress with updated HAP Tables
Challenges to Date • Industry Priorities: • Asset managers are focused on reliability. Separating efficiency from reliability is not credible. What is appropriate DOE role? • Industry focuses on licensing challenges—upgrades are always controlled by licensing risk management more than efficiency cost-benefit • Capital allocation—incremental hydropower does not compete well with large chunks of baseload capacity expansion or quick-payback flexible gas-fired generation. • Lessons learned • HAP will need to address absence of monitoring data and estimate value of monitoring • Asset management and operations staff are aware of conditions and upgrade opportunities—HAP focus should allow for interview/cataloging as much as direct inspection. • Hydropower operations data for performance assessment may have longer lead time than anticipated
Next Steps FY12 Next Steps • RFI issue Nov 2011 to gather feedback on proposed assessment—consider alternative procurement methods • Technical Expert Review of BPC and Manuals • Enhanced collaboration of Corps and Reclamation to leverage HydroAMP and HMI experience for non-federal assets • Resolve process for performance assessment on many assets—individual assessments or core team assessments? Additional Opportunities • Apply performance and condition assessment to FY10 ARRA-funded upgrade projects • Apply performance and condition assessment to multiple projects in Optimization Toolset Demos • Interface with industry initiatives for operational excellence • Long-term program for collaborative benchmarking based on HAP database