
Cell Cycle Dynamics in Infected Cells: A Comparative Analysis of DNA Levels
This study analyzes DNA levels at different cell cycle stages in infected cells. Results show variations in DNA content between synchronized and unsynchronized cells, with implications for understanding infection dynamics.

Cell Cycle Dynamics in Infected Cells: A Comparative Analysis of DNA Levels
E N D
Presentation Transcript
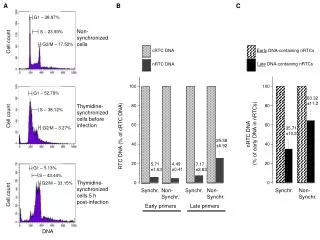
A B C G1 – 38.97% Non- synchronized cells S – 23.93% Cell count G2/M – 17.52% cRTC DNA Early DNA-containing nRTCs Late DNA-containing nRTCs nRTC DNA 100 100 G1 – 52.79% 63.32 ±11.2 Thymidine- synchronized cells before infection 80 80 S – 38.12% Cell count 60 60 G2/M – 3.27% 35.71 ±10.3 nRTC DNA (% of early DNA in nRTCs) RTC DNA (% of cRTC DNA) 25.58 ±6.92 40 40 4.49 ±0.41 5.71 ±1.63 7.17 ±2.83 20 20 G1 – 5.13% S – 43.44% Thymidine- synchronized cells 5 h post-infection G2/M – 33.15% 0 0 Synchr. Non- Synchr. Synchr. Non- Synchr. Synchr. Non- Synchr. Cell count Early primers Late primers DNA