Download
1 / 2
20 likes | 37 Views
In Candlesticks charts, the price movement of a stock is depicted over a time period. Because this type of chart is easy to read and understand, it is quite popular among traders.

E N D
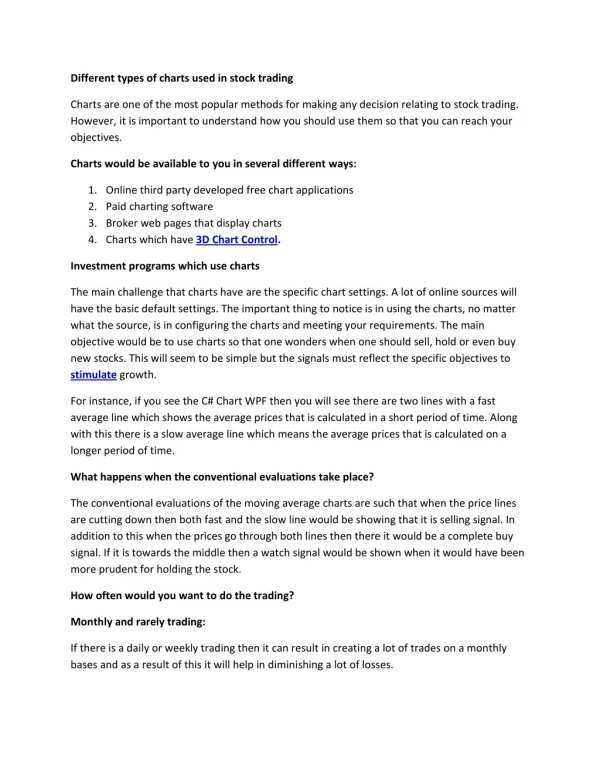
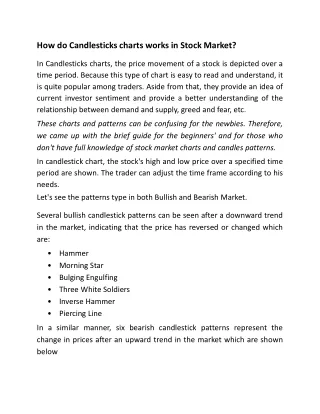
How do Candlesticks charts works in Stock Market? In Candlesticks charts, the price movement of a stock is depicted over a time period. Because this type of chart is easy to read and understand, it is quite popular among traders. Aside from that, they provide an idea of current investor sentiment and provide a better understanding of the relationship between demand and supply, greed and fear, etc. These charts and patterns can be confusing for the newbies. Therefore, we came up with the brief guide for the beginners' and for those who don't have full knowledge of stock market charts and candles patterns. In candlestick chart, the stock's high and low price over a specified time period are shown. The trader can adjust the time frame according to his needs. Let's see the patterns type in both Bullish and Bearish Market. Several bullish candlestick patterns can be seen after a downward trend in the market, indicating that the price has reversed or changed which are: • Hammer • Morning Star • Bulging Engulfing • Three White Soldiers • Inverse Hammer • Piercing Line In a similar manner, six bearish candlestick patterns represent the change in prices after an upward trend in the market which are shown below
• Shooting Star • Bearish Engulfing • Hanging Man • Evening Star • Dark Cloud Cover • Three Black Cows Understanding these candlestick patterns will be extremely helpful to you as a new trader. Even minute-long trading cycles can be analyzed using candlestick signals - even for daily or hourly cycles of trading.