Download

1 / 44
440 likes | 707 Views
CONEWAGO CREEK GROUND WATER STUDY Base Flow and Impervious Cover November 7, 2007 Watershed Alliance of Adams County. Joe McNally, P.G. GeoServices, Ltd. Camp Hill, PA. Study Area. “West” Conewago Creek upstream of the stream gage at East Berlin

E N D
CONEWAGO CREEK GROUND WATER STUDYBase Flow and Impervious CoverNovember 7, 2007 Watershed Alliance of Adams County Joe McNally, P.G. GeoServices, Ltd. Camp Hill, PA
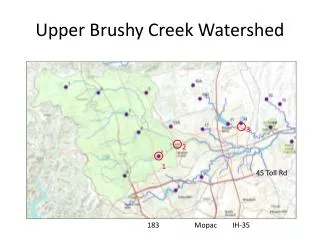
Study Area • “West” Conewago Creek upstream of the stream gage at East Berlin • Official U.S. Geological Survey designation uses “West” • 219 square miles in northeast part of Adams County
Watershed Issues • Susquehanna River Basin Commission (SRBC) has identified water challenged and potentially stressed areas in the watershed (diabase, Bonneauville shale, fruit belt, and Hanover area) • 81% of water use in Adams County is from ground water • Watershed is located in area where water use planning is critical
Study Topics • Evaluate ground water resources in the watershed in particular: • Base flow (recharge) • Impervious Cover
Base flow - What is it? • The portion of flow in a stream that results from precipitation (both rainfall and snowmelt) that infiltrates into the ground. • Base flow is the ground water contribution to the stream and is used to estimate the amount of ground water available for use. • Base flow changes and is dependent on the amount of rainfall. • Only part of the base flow can be used (this is where planning comes in).
Base Flow Calculation Base flow is calculated (not measured directly). Methods to calculate base flow 1. Stream flow data (East Berlin gage) 2. Geology/Rock-type 3. Others
Stream Flow Data • Calculated on a yearly basis to allow for seasonal changes • Value changes from year-to-year because rainfall does too • Takes several years of stream gage data to obtain a reliable average value for base flow
Stream Flow Data • Measures base flow for the area gaged (the watershed) • Does not distinguish base flow in smaller subbasins
Use of Geology/Rock Type to Calculate Base Flow • Different rocks will accept different volumes of water (have different recharge amounts) • diabase and Bonneauville shale = very low • Carbonate rocks (e.g., Conestoga Formation) have higher recharge values • Recharge values by rock type have been estimated by computer simulations (U. S. Geological Survey)
Geology in Watershed • Different rock types are present in the watershed
Geology in Watershed • 22 different rock types cover the watershed • Similar rock types are grouped together and assigned a recharge value
How to Use the Geologic Units to Calculate Local Recharge • Measure the area (For example, assume a of 275 acre site in Gettysburg formation) • Convert to square miles (275 acres divided by 640 acres per square mile) 275/640 = 0.43 square miles • Multiply area by recharge value for rock type (Gettysburg = 0.34 mgd/mi2) • Average recharge = 0.43 mi2 x 0.34 mgd/mi2 = 0.146 million gallon per day or 146,000 gallons per day. • Planning amount is less than calculated recharge. Generally only 50 to 60%
Watershed Base Flow • Calculate the area of each geologic unit in the watershed • Multiply total area by a recharge value for the rock type • Total recharge (base flow) for the watershed is about 81 million gallons per day • NOTE: Not all of this can be used for water supply
Comparison of Geology Results • Results from the geology/rock method compare favorably with calculations for the entire West Conewago Creek Watershed • Geology/rock method allows for estimation of base flow using existing data. • Can be used in area smaller than portion of watershed that is gaged.
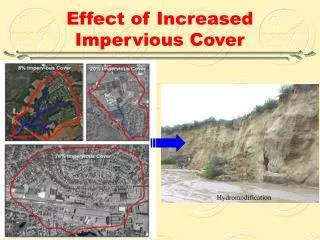
Impervious Cover – What is it? • Roads, buildings, parking lots, sidewalks and other paved or covered surfaces that prevent infiltration into the ground
Impervious Cover Why of concern? • Impervious cover prevents precipitation from seeping into the ground • Speeds runoff directly to stream, and reduces the amount of water that can infiltrate • Damage to stream • Less ground water recharge (base flow) • Can influence the entire watershed
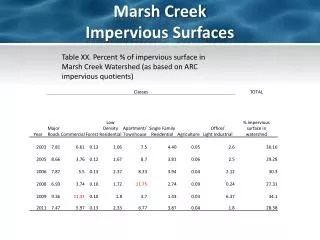
Estimate of Impervious Cover Impact to Base Flow • Aerial photos not yet available to estimate area, so correlation used between population density and impervious cover. • Focus on areas where impervious cover greater than 10 percent. • No one rule of thumb when too much impervious is detrimental
Impervious Cover • Percent impervious cover was considered to be areas of zero recharge (no contribution to base flow) • If straight percentage of 5, 10 and 15% of impervious cover used, reduction to base flow may be between 4 and 12 million gallons per day in the watershed • Estimates based on population density and greater than 10 percent impervious cover show about 2 million gallons per day reduction in base flow.
Impervious Cover What to do? • Implement storm water guidelines (Act 167). • These guidelines provide good model for reducing runoff and increasing infiltration. • Should include best management practices to prevent degradation of water quality • Follow SRBC recommendation to evaluate impact of impervious cover after build out
Summary and Conclusions • Planning ground water use is important in the West Conewago Creek watershed. • Base flow (recharge) is a key factor in evaluating the ground water resource. • Stream gage measurements for additional years are needed before average base flow can be calculated.
Summary and Conclusions (continued) • Estimates of base flow and local recharge can be prepared using information for different geologic units. • No single threshold value exists for the impact to base flow from impervious surfaces
Recommendations • Consider use of hydrogeologic parameters (geology method) to calculate base flow in smaller subbasins as part of a water planning strategy • Include consideration of impact to recharge as part of future land use planning. • Continue stream gaging at East Berlin to allow for understanding trends and long term averages
Recommendations • Adopt storm water management practices (Act 167) to minimize impact of impervious cover • Follow SRBC recommendations to validate the impacts of impervious cover. • Prepare overall water budgets with water use data (Act 220 data) and include results in overall water planning strategies.