Download
1 / 33
330 likes | 342 Views
This presentation provides an overview of open data on air quality, focusing on the current situation and available possibilities for users. It covers measurement data, models, forecasts, and dispersion and effects models. The presentation also discusses the contribution of the Finnish Meteorological Institute and other data sources. Additionally, it explores the impact of ship emissions and the calculation system for ship emissions. The presentation includes relevant links and resources.

E N D
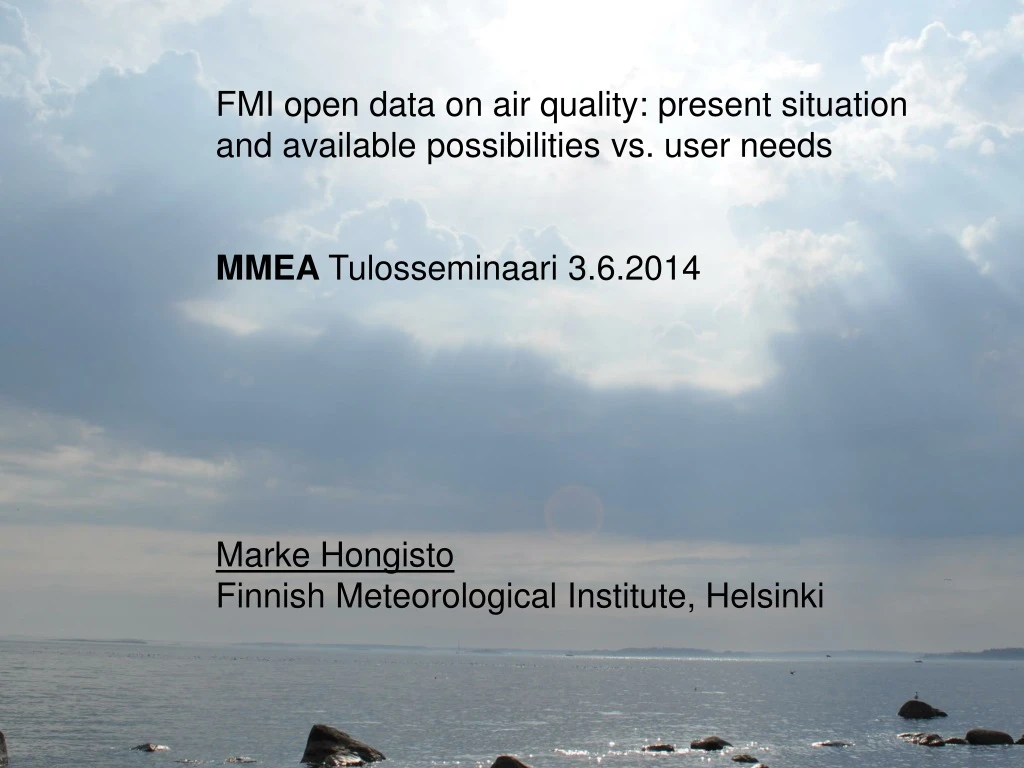
FMI open data on air quality: present situation and available possibilities vs. user needs MMEA Tulosseminaari 3.6.2014 Marke HongistoFinnish Meteorological Institute, Helsinki
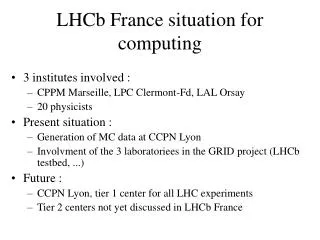
Content: 1) MMEA FMI contribution: Hilatar deposition fields, uncertainty Other data sources : 2 )Measurements: concentrations and depositions, www.ilmanlaatu.fi www.emep.inthttp://www.nilu.no/projects/ccc/emepdata.html http://www.eea.europa.eu/data-and-maps/data/airbase-the-european-air-quality-database-8 3) Models: Hilatar, simulation results since 1993; European scale 4) SILAM: European and local forecasts for chemical compounds and deposition, acid chem, O3-chem, pollen, PM and selected meteorological variables http://silam.fmi.fi/thredds/catalog.html Europe and regional, last 14-16 day forecasts no data archives collected ! http://macc-raq.gmes-atmosphere.eu/ 96 hour forecasts for seven European models, analysis and surface observations only concentrations in air NO2, SO2, CO, PM10, PM2.5, pollen; surface, 500 m, 1 and 3 km
HIRLAM RCR 0.068 ECMWF, ECHAM HARMONIE 0.022o AROME, LAPS Modelling system - FMI Dispersionmodels - long-range, regional Dispersion and effects models – urban, local Weather prediction models SILAM LRT, meso, radioactivity CAR-FMI, roadside UDM-FMI, urban OSPM (NERI), street canyon HILATAR LRT, meso BUOYANT, fires ESCAPE, chemical accidents Aerosol process models: UHMA (U Helsinki, FMI) MONO32 (U Helsinki, Stadia) FLUENT, CFD code EXPAND (FMI, YTV) population exposure MPP-FMI, Meteorological pre-processing model Meteorological measurements
Open data depositions, HILATAR • Hilatar, 3D Eulerian, Acid dep chemistry, • BS model: 0.08 – 0.068o resolution model with 20-21 vertical layers, nested with an European 3D model • Meteorology: FMI HIRLAM 6th hr weather predictions • Emissions: EMEP, MACC, FMI ship emission inventory, Finnish national (FEI) and NW Russia inventories • Period simulated 2008-2011 for SNOOP with 0.068o resolution • EU directive (2005/33/EC) :Over the BS, North Sea and the English Channel (SOx Emission Control Areas SECA) the maximum allowable sulphur content of marine fuels decreased from 1.5 to 1 % in July 2010, and to 0.1 % in port areas in 1 January 2010. • Open data: Currently 6h time interval deposition data, in FMI internal data interface, in test , dry and wet dep for Nox, NHx and S • Doc: http://lib.hut.fi/Diss/2003/isbn9512264811/index.html • Hongisto 2014: Oceanologia 56 (2-TI) 2014http://www.iopan.gda.pl/oceanologia/562hongi.pdf
Ship emission calculation system: www.shiphodeff.orghttp://snoop.fmi.fi/)Planned by the old FIMR (Stipa et al.); UTU and FMI realization, FMA and VTT supportShips send AIS-safety signals, short data pursts with information on ship’s location, speed, physical dimensions, destination and cargo. (Jalkanen e.a, Atmos Chem Phys 2009,2012) Emission estimate, f(ship type,engine load,fuel Type, speed, emission control technology…) dt ~ 450 s, on-line, gridded; NOx,SOx,COx,PM Weather and wave data Other national Maritime Adm.’s In the BS area Machinery data FMI AIS-decoder UTU E algorithms Lloyds DB IMO No. HELCOM DB AIS signals, SafeSeaNet Position update dt ~ 2 s Finnish Maritime Adminstration FMA DB AIS signals AIS- receiver station Automatic Identification System (AIS) AIS- transmitter, ships > 300 Gt
Uncertainties in the modelling are related to the emissions and meteorology E: Macc does not include natural emissions and EMEP not all Russian sources 2007 NH3: BS model area: 877 Gt EMEP, 922 Gt MACC
Currently total depositions of NOx, S and NHx with 6 hr time interval in 0.068o grid (Hirlam); dry and wet depositions for oxidized, reduced nitrogen and sulphur. It is possible to release also the European deposition and concentrations originated from ships, Finland or Kola peninsula. AND all 3D meteorological parameters used in simulations
Above: Hilatar, deposition to open water areas, 372 954 km2. Shares of the ship emi originated deposition: NOx 12-15 %; S: decline from 28 to 20 % 2009-2011. EMEP Baltic Sea (BAS) 2011 Total S deposition 73,2 kt S BS ship emission originated deposition to BAS SOx 15,6 kt S NOx 11,3 kt N EMEP: http://helcom.fi/baltic-sea-trends/environment-fact-sheets/eutrophication/nitrogen-atmospheric-deposition-to-the-baltic-sea/ http://emep.int/publ/reports/2013/EMEP_status_report_1_2013.pdf Hilatar: January 2014 run (SO4 conversion rate faster than in Oceanologia 2014 results)
Right: NO3-deposition 2009, correlation, all one day values 0.634801, N=5324, 0.068omodel resolution; ave model 0.64078 ave measurement 0.597357 mg N m-2, Left: Difference in accumulated precipitation due to meteorological model and difference of measured and modelled precipitation at EMEP stations.
target and limit values(2008/50/EY), PM, d < 2.5 µm (PM2.5) annual average valid since Target value 25 μg/m3 1.1.2010 Limit 1. 25 μg/m3 1.1.2015 Limit 2. 20 μg/m3 1.1.2020 WHO ref value 10 μg/m3 annual average WHO highest daily concentration 25 μg/m3 (WHO, 2006). Meas from mass at background stat (2008/50/EY). SO42-, Na+, NH4+, Ca2+,NO3-,K+ ,Cl- Mg2+,EC, OC Source http://www.ilmanlaatu.fi/ilmansaasteet/julkaisu/pdf/pienhiukkasten_alustava_arviointi_2011_2.pdf SO4 should be 1.5-times higher (unit conversion error from S to SO4)
target and limit values(2008/50/EY), PM, d < 2.5 µm (PM2.5) annual ave valid since Target value 25 μg/m3 1.1.2010 Limit 1. 25 μg/m3 1.1.2015 WHO ref value 10 μg/m3 annual average Limit 2. 20 μg/m3 1.1.2020 WHO highest daily concentration 25 μg/m3 (WHO, 2006).
SNOOP PM simulations: Rasila and Loven 2013 Local scale AQ sim, Turku Helsinki • PM health effects of ships: Soarese.a., 2014 Geosci Model dev discuss 7, 2335-2375 • Population exposure to PM2.5, Helsinki Metropolitan area: • - Long range transport LRT: 86 %, • Vehicular emissions 12 %, • shipping 2 % • But: Only primary PM emissions, no secondary particles (SO4) included • Part of the LRT primary PM is originated from ship emissions • The chemical composition of particulate matter at six urban background sites in Europe • was studied during 7-week field campaigns (Sillanpää et al., 2006). • The mean concentrations of PM2.5 8.5 to 30 and PM2.5-10 5.4 to 29 µg m-3 • PM2.5 composed of organic matter, EC, secondary inorganic aerosols and sea salt (SS), • PM2.5-10 of soil-derived particles, carbonaceous compounds, SS and nitrate. • Non-SS-SO4 contributed from 14 to 31 % to PM2.5 and 0.8 to 6.8 % to PM2.5-10. • NO3 contributed from 1.1-18 % to PM2.5 and 3.7 – 14 % to PM2.5-10; • NH4 7.9 – 9.3 % to PM2.5 and 0.06-2.7 % to the PM2.5-10 fraction. • The share of the modelled ship originated SO4 concentration of the total PM2.5 on the • coastal lines of BS varies thus from 0.3 % to 12 %, being approximately below 9 % at • most (> 90 %) of the coastline and below 5 % at around 70 % of the BS coastline. • If the aerosol chemical composition of Sillanpää et al., 2006 is used, of the total PM mass • below 10 µm only 0.15 - 6 % along the BS coastline is BS ship-originated sulphate.
Verified measurements: SO2, NO2, O3, CO, stinking S compounds PM10 j and PM2.5 Table (csv or ssv formats) and graphics MEASUREMENTS concentrations AQ PORTAL Background -> industrial stations The air quality measurements from AQ portal will be opened in OGC format 2014-2015
MEASUREMENTS Concentrations and Depositions: www.emep.int Background stations Since start of the measurements
http://www.nilu.no/projects/ccc/index.html http://www.nilu.no/projects/ccc/emepdata.html EMEP measurement data online Please refer to the latest data report relevant to the data you are using. Download data: Acidifying and eutrophying compounds Ozone Heavy metals POPs Particulate matter (Joint EMEP, GAW-WDCA and CREATE database) VOC
Euroopan ympäristökeskus, AIRBASE tietokanta Raportoitavat yhdisteet http://eur-lex.europa.eu/legal-content/EN/ALL/?uri=CELEX:32011D0850 Data julkaistaan noin vuosi mittausvuoden päättymisestä tietokannassa http://www.eea.europa.eu/data-and-maps/data/airbase-the-european-air-quality-database-8 asemien ja komponenttien koodit ovat tiedostossa AirBase_v5_measurement_configurations.zip Voit ladata kaikkien EU-maiden ilmanlaatutiedot AirBase_v8_statistics.zip (ZIP archive - 26MB) sisältää valmiit tilastodatat AirBase_v8_stations.zip (ZIP archive - 344KB) asemakuvaukset Finland AirBase_FI_v8.zip (ZIP archive - 28MB) Download file IL vastuuhenkilön Mika Vesteniuksen mukaan tämä data siirtyy avoin data rajapintaan jossain vaiheessa Tiedosto rawdata.zip sisältää ilmanlaatutiedot, 111 asemaa, 930 tiedostoa, dataa ainakin 1993 lähtien Asemanumerot löytyy stations- ja tilastot statistics-tiedostoista
Simulation control Aerosol dynamics Transformations Source types Acid-basic Area Simple Point CB4 Basic SOx Nuclear bomb Pollen Bio-VOC Transformation General PM Pollen Map of species masses Radioactive Sea salt Emission Transformation Passive self-decay Deposition Long-lived multi-media Deposition Dry Forcing Initialization, 3D-Var Advection diffusion Wet Dynamics Models; SILAM v.5: outlook forward adjoint 4D-Var • Modules • 8 chemical and physical transformation modules • 6 source terms • 2 aerosol dynamics • 3D- and 4D- Var • Meteo input: • ECMWF • HIRLAM, AROME, HIRHAM, ECHAM, and any other who can write GRIB-1 or GRIB-2 • WRF
Silam data THREDDS Data Server 4.5 Documentation: http://www.unidata.ucar.edu/software/thredds/current/tds/TDS.html
NetcdfSubset:/thredds/ncss/grid/silam_regional_v5_2/runs/silam_regional_v5_2_RUN_2014-05-28T00:00:00ZNetcdfSubset:/thredds/ncss/grid/silam_regional_v5_2/runs/silam_regional_v5_2_RUN_2014-05-28T00:00:00Z
Longer time archives: MACC project http://macc-raq.gmes-atmosphere.eu/
The MACC regional air quality (RAQ) production is based on seven state-of-the-art numerical air quality models developed in Europe: CHIMERE by INERIS (France), EMEP by MET Norway (Norway), EURAD-IM by University of Cologne (Germany), LOTOS-EUROS by KNMI (Netherlands), MATCH by SMHI (Sweden), MOCAGE by M�t�o-France (France) and SILAM at FMI(Finland). All models use the same information for the meteorological parameters (from ECWMF weather global operational system), the same boundary conditions for chemical species (from MACC IFS-MOZART global production), the emissions (from MACC EMIS and FIR subprojects). models provide - daily forecasts of the concentration of the main atmospheric pollutants in the lowest atmospheric layers for the following 4 days with a horizontal scale is around of 10 to 20 km. Ensemble and individual model analyses and forecasts • daily a posteriori analyses of pollutants near the surface, by assimilating observations of the day before. Surface observations from the air quality monitoring stations from European can be found for 24 hours of the last month for O3, NO2, SO2, CO, PM10 and PM2.5 from http://macc-raq.gmes-atmosphere.eu/som_obs.php Numerical data (concentrations) from the seven individual production chains in Netdcf format and from the ensemble chain (in Netcdf and Grib-Edition2 format) are available after acceptance of the Licence terms and the registration on http://www.copernicus-atmosphere.eu/request_regional_data/
NO3 deposition, monthly values Thank you For atteNtion