Download

1 / 13
130 likes | 147 Views
Learn how to create gridded population data by aggregating point-based sources, projecting data into grids, and joining aggregated data in ArcGIS for Eurostat compatibility.

E N D
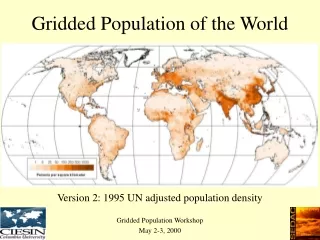
How to produce population gridded data - the aggregation approach Ola Nordbeck Statistics Norway
Conversion and aggregation of point-based source data into grids • Collection - of micro data and the European LAEA grid net • Projection - from national coordinate system to European ETRS89-LAEA • Creation of grid cell identification codes • Aggregation(sum) of population figures per LAEA grid cells • Join aggregated data with the LAEA grid net • Making the populated grid data compliant with Eurostat data description
Collection • Collecting datasets • Georeferenced national micro data or populated national grid data • LAEA grid net country clip: Can be downloaded from http://www.efgs.info/data/european-datasets/eurogrid • Analysing micro data and LAEA grid net country clip • Analysing the Spatial extent of the grid net grid net country clip • In ArcGIS: • 1. Add micro data of interest and the “country clip” grid • 2. Carry out the spatial selection and verify the data: • Go to the main menu and chose Selection > Select By Location • In the dialog box enter: • Selection method: “Select features from” • Target layer: the micro data • Source Layer: “country clip” • Spatial selection method: Target layer features intersect the Source layer feature • 3. Verify the result of the selection in the table – all points should be selected • Right click on the micro data layer and select “Open attribute table”
Reprojection • Reprojection of national micro data • In order to preserve the sphere-like body properties each country has various ways to project national map data. This is also the case on a European level. In order to populate the European LAEA grid the national point-based microdata or grid data need to be reprojected into ETRS89/LAEA. • In ArcGIS: • 1. To reproject data from national projection to ETRS89-LAEA using Project tool. See figure below. • A. In ArcToolbox go to Data Management > Tools > Projections and Transformations > Project • B. Enter the micro data as input and verify that the input coordinate system is correct. Define the output dataset and coordinate system (select “Coordinate Systems\Projected Coordinate Systems\Continental\Europe\ETRS 1989 LAEA.prj”)
Creation of grid cell identification codes • Grid cell identification codes are based on grid cell’s lower left-hand corner coordinates truncated by grid cell size: • 1kmN4534E5066 is result from coordinates Y=4534672, X=5066332 and the cell size 1km • Spatial join approach and tabular approach • The easiest way to create ids is to join the reprojected data spatially with the grid dataset. • Tabular approach generating ids is to prefer for heavy datasets • In ArcGIS: • A. In ArcToolbox go to Analysis Tools > Overlay > Spatial Join • B. Enter the point dataset as target features and the “country clip” as join features. Set “Intersect” to be the match option
Aggregation of population figures by LAEA grid cells • Aggregating micro data using tabular data approach • Aggregating micro data using SAS, SQL, Excel • Aggregating of grid cell centroids using GIS software • In ArcGIS: • A. In ArcToolbox go to Analysis Tools > Statistics > Summary statistics • B. Input table: Your new point layer • Statistics field: Tot_P • Statistics type: SUM • Case field: GRID_ID
Join with the LAEA grid net Join aggregated data with the “Country clip LAEA grid net” using ArcGIS • In order to generate a spatial dataset with population by square grid cells • In ArcGIS: • A. In order to join the two datasets in ArcGIS use Join fields • B. In ArcToolbox go to Data Management Tools > Joins > Join Field • C. As input dataset enter the “country clip” and specify GRID_ID to be the join field • D. As join table add the aggregated table and the GRID_ID as join field. Select thereafter from the field list the fields to be included in the join
Making the populated grid data Eurostat compliant - data description, 1 The European dataset has a standardized table structure with pre-defined primary keys (marked with *):
Making the populated grid data Eurostat compliant - data description, 2 The GEOSTAT 1B project aimed for having population variables by sex and age following a standardised structure: • Total population • Population by sex • Population by sex and age:
Making the populated grid data Eurostat compliant - data description, 3 During the GEOSTAT 1B project it was discussed to include a confidentiality treatment method description per grid cell: "TOT_P_CON_DT” is a text field. Proposed by Eurostat to be a 10 characters long [field length] indicating if the cell: • is not treated/manipulated [proposed value: “0”] • is treated with a threshold value, by indicating the threshold value below which information is treated. • is treated with other methods
Making the populated grid data Eurostat compliant - data description, 4 In order to : • In ArcGIS: • A. In order to structure the data according to Eurostats guidelines for population grids use the table field options in ArcGIS • B. In ArcToolbox go to Data Management Tools > Fields > Add Field/Delete Field or Calculate Field • C. Make your data Eurostat compliant (slide 8-9) • D. Identify a way to render this table work more efficient?
Exercise 1. Find test data on the server 2. Produce gridded population statistics using the point data set and empty grid net 3. In case you are done and wait for others. Find the Quality Assessment sheets as handed out and consider how to complete it using your national data
Discussion 1. About the exercise 2. About the Quality Assessment sheets