Download
1 / 15
150 likes | 166 Views
Do Now: a) If you were measuring the mass of an object and accidentally dripped some water on the triple beam balance and ignored it, what would that do to your density calculation?. It would increase your density because water adds more mass.

E N D
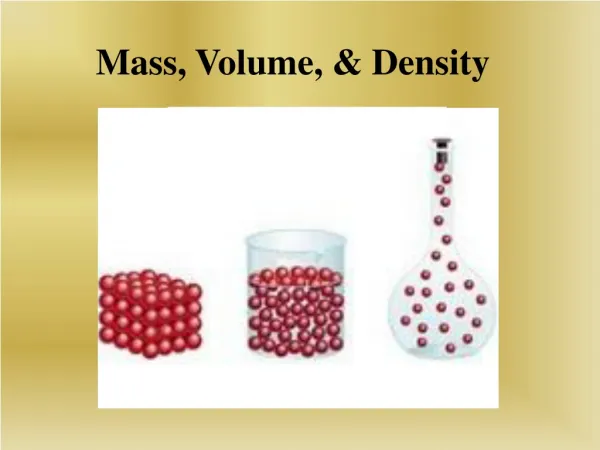
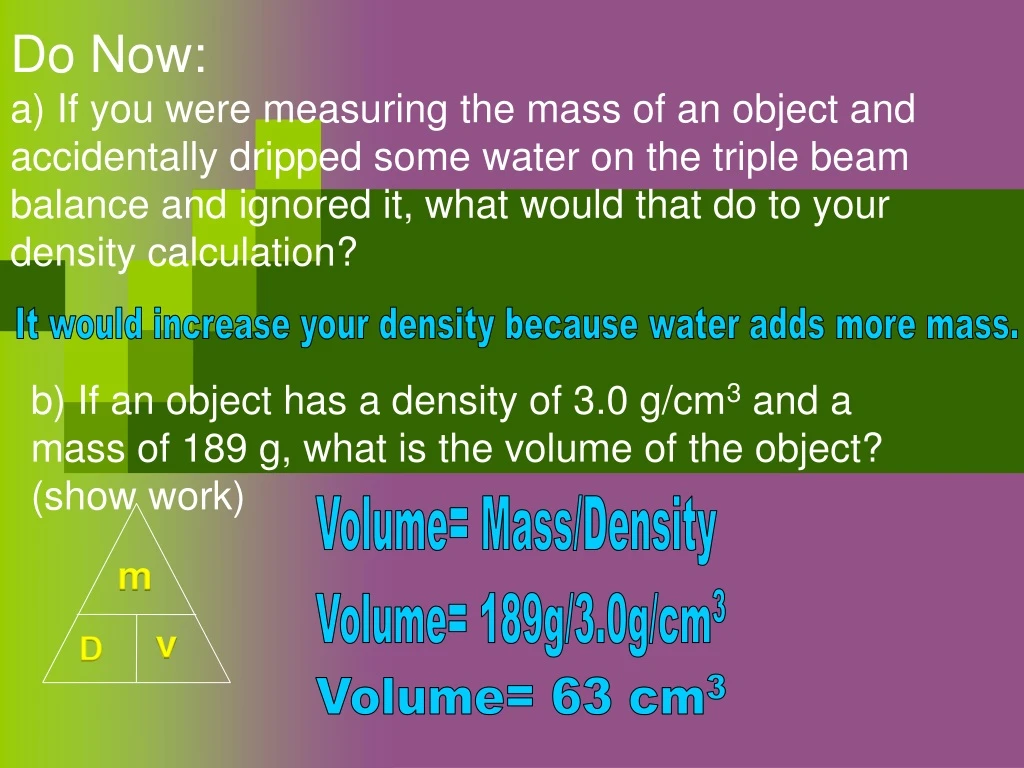
Do Now:a) If you were measuring the mass of an object and accidentally dripped some water on the triple beam balance and ignored it, what would that do to your density calculation? It would increase your density because water adds more mass. b) If an object has a density of 3.0 g/cm3 and a mass of 189 g, what is the volume of the object? (show work) Volume= Mass/Density m Volume= 189g/3.0g/cm3 v D Volume= 63 cm3
Which is faster to understand? Why? • Value of Sarah's Car Year Value 2001: $24,000 2002: $22,500 2003: $19,700 2004: $17,500 2005: $14,500 2006: $10,000 2007: $ 5,800
Aim: How do we organize data to make it easier to analyze? Topic: Prologue Main Idea: Graphing
1) What are the two graphing axes? A) X-axis: horizontal axis used for the independent variable B) Y-axis: vertical axis used for the dependent variable
2) What is the difference between the independent and dependent variables? The independent is the cause of change in an experiment and the dependent is what changes when you change the independent.
3) Define direct relationship: If X increases then Y also increases The line goes uphill
4) Define inverse relationship: If X increases then Y decreases The line goes downhill
5) Draw a line to show graphs with the fastest and slowest rates. slowest fastest distance distance time time
6) What do straight lines on a graph show? Constant rate (not speeding up or slowing down)
7) What do curved lines on a graph show? Increasing or decreasing rate
8) How can we tell quickly which graph is changing at the fastest rate? It is the steepest line a b Which line is faster? How can you tell? c The steeper the line (more vertical) the faster the rate.
9) Look at these two graphs. Describe the relationship and rate. inverse direct increasing decreasing
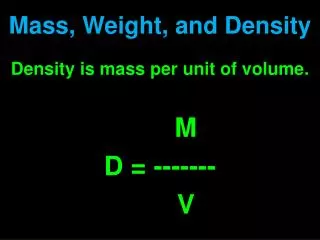
10) How do we calculate how fast something is changing? change in value • Rate of change= ____________________ time
8 6 . 4 . 2 . 0 1 2 3 4
Summary: On the two graphs below, draw a graph showing a direct relationship with decreasing rate and a graph showing an inverse relationship with increasing rate.