Download
1 / 27
270 likes | 471 Views
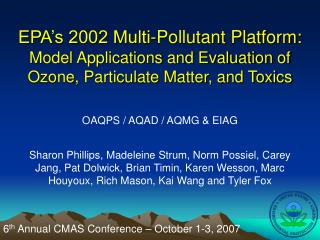
EPA’s 2002 Multi-Pollutant Platform: Model Applications and Evaluation of Ozone, Particulate Matter, and Toxics. OAQPS / AQAD / AQMG & EIAG. Sharon Phillips, Madeleine Strum, Norm Possiel, Carey Jang, Pat Dolwick, Brian Timin, Karen Wesson, Marc Houyoux, Rich Mason, Kai Wang and Tyler Fox.

E N D
EPA’s 2002 Multi-Pollutant Platform:Model Applications and Evaluation of Ozone, Particulate Matter, and Toxics OAQPS / AQAD / AQMG & EIAG Sharon Phillips, Madeleine Strum, Norm Possiel, Carey Jang, Pat Dolwick, Brian Timin, Karen Wesson, Marc Houyoux, Rich Mason, Kai Wang and Tyler Fox 6th Annual CMAS Conference – October 1-3, 2007
Outline • Introduce concept of a modeling platform • Introduce 2002 modeling platform and components • Criteria Air Pollutants Only “CAP-only” • Criteria Air Pollutants + Hazardous Air Pollutants “CAP+HAP” • Initial Model Evaluation CAP-only • Initial look at differences in CAP-only vs CAP+HAP results
What is a “Modeling Platform”? • Structured system of connected modeling-related tools and data that provide a consistent and transparent basis for assessing the air quality response to changes in emissions and/or meteorology
2002 Modeling Platform Overview • CAP-only with CMAQ 4.6.1i Base Model, cb05, without Chlorine • 2002 NEI – Criteria pollutants only • Ozone, PM • Some CB05 model species considered explicit • FORM • ALD2 • MEOH • ETOH • Projection years developed to support regulatory applications • CAP+HAP with CMAQ 4.6.1i Multipollutant model, cb05txhg, with chlorine chemistry • 2002 NEI – Criteria pollutants and HAPs • Ozone, PM, and additional 38 HAPs • Does not include projections • AERMOD used for local scale modeling in Detroit • Ultimately, certain aspects of these two platforms may merge into a single platform
HAP CAS# Acrylonitrile 107 - 13 - 1 Carbon Tetrachloride 56 - 23 - 5 Propylene Dichloride 78 - 87 - 5 1,3-dichloropropene 542 - 75 - 6 1,1,2,2 - Tetrachloride Ethane 79 - 34 - 5 Benzene 71 - 41 - 2 Chloroform 67 - 66 - 3 1,2 - Dibromomethane 106 - 93 - 4 1,2 - Dichloromethane 107 - 06 - 2 Ethylene Oxide 75 - 21 - 8 Methylene Chloride 75 - 09 - 2 Perchloroethylene 127 - 18 - 4 Trichloroethylene 79 - 01 - 6 V inyl Chloride 7501 - 4 Naphthalene 91 - 20 - 3 Quinoline 91 - 22 - 5 Hydrazine 302 - 01 - 2 2,4 - Toluene Diisocyanate 584 - 84 - 9 Hexamethylene 1,6 - Diisocyanate 822 - 06 - 0 Maleic Anhydride 108 - 31 - 6 Triethylamine 121 - 44 - 8 1,4 - Dichlorobenzene 106 - 46 - 7 Total Formaldehyde 50 - 00 - 0 Total Acetaldehyde 75 - 07 - 0 Total Acrolein 107 - 02 - 8 1, 3 - Butadiene 106 - 99 - 0 Formaldehyde Emissions Tracer 50 - 00 - 0 Acetaldehyde Emissions Tracer 75 - 07 - 0 Acrolein Emissions Tracer 107 - 02 - 8 Gas Phase HAPs in CMAQ v4.6.1i National or Regional Risk driver in NATA 1999
HAP Beryllium Compounds Nickel Compounds Chromium (III) Compounds Chromium (VI) Compounds Lead Compounds Manganese Compounds Cadmium Compounds Diesel Emissions Tracer Aerosol Phase HAPs in CMAQ v4.6.1i Multi- Phase HAPs in CMAQ v4.6.1i Mercury
2002 National Emissions Inventory • Best integration of CAPs and HAPs to date • Mobile Sources • On-road mobile from states or NMIM using MOBILE6 • Nonroad mobile from states or NMIM using NONROAD 2005 • Aircraft, Locomotive, and Marine from national totals subdivided to counties, and state data • Electric Generating Units (EGUs) • CEM data for SO2 and NOx • Other pollutants use state or filled-in data • NonEGU stationary point sources from state data • Nonpoint (area) sources, including agricultural NH3 from animals and fertilizer • Wildfires and prescribed burning are (mostly) daily point-source based data
SMOKE Emissions Processing • Created SMOKE 2.3.2 specifically for platform • Day-and-location specific wildfires and prescribed burning • Biogenics from BEIS 3.13 with 2002 meteorology • EGUs: Hourly CEM data for SO2 and NOx (other pollutants follow hourly heat input) • Ancillary data updates • SPECIATE4.1 speciation profiles via EMF’s Speciation Tool • New spatial surrogates vis EMF’s Surrogate Tool • Some temporal profile changes from 2001 platform
Special Features of SMOKE Processing for CAP+HAP • We chose to “integrate” HAP VOC with VOC for sources which we felt had consistent set of VOC and HAP VOC • Nearly all onroad and nonroad • Most EPA-generated nonpoint • Some nonEGU point • Integrate means HAP emissions are used to modify the speciation of VOC • We used only HAP emissions for HAP model species (not speciation of VOC) • For formaldehyde, acetaldehyde and methanol, use HAP inventory
Difference in Speciation CAP-only vs CAP+HAP Example for FORM CAP-Only: VOC TOG FORM CAP + HAP Integrate Not explicit formald FORM NONHAPVOC NONHAPTOG FORM FORMALD No-Integrate Profile with FORMALD removed VOC TOG FORM FORM FORMALD
2002 Meteorological Data(presentation by Pat Dolwick, Session 3) • Annual MM-5 Simulations • 36 km US,12 km EUS,12 km WUS (from WRAP) • Similar configuration as 2001 MM5 (but not identical) • MM5 data processed via MCIP v3.1 into CMAQ • Model evaluation indicated similar model performance as the 2001 MM5 simulations • Reasonable approximation of the actual meteorology • Primary concern: 2-3 deg C underestimation of temperature in the winter months. • Journal article fully summarizing evaluation findings will be available in 2008 (as part of CMAS).
Boundary Condition Concentrations • GEOSChem – Global Chemistry Transport Model developed at Harvard Univ. • 2002 simulations of GEOSChem provided via ICAP • Domain covers entire globe: 2o x 2o grids and 30 layers up to the Stratosphere • Provides Boundary Conditions for CAPs and mercury and some other HAPS (e.g., formaldehyde) for our 36 km CONUS domain • For toxics not simulated by GEOSChem we used concentrations based on remote measurements and values in the literature
Model Domains 36km Domain Boundary 12km West Domain Boundary 12km East Domain Boundary
Model Performance Analysis • PM2.5 Species: SO4, NO3, TNO3, OC, EC, SO2 • STN, CASTNet, IMPROVE, NADP • Ozone: 1 hr-max & 8 hr-max • AQS, SEARCH • HAPs: Formaldehyde, Acetaldehyde, etc., + metals • NATTS, STN, IMPROVE • Graphics and Statistics: hourly, daily, monthly, seasonal & annual • Spatial maps comparing observed and predicted species concentrations/deposition • Scatter plots of observations vs predictions • Time-series plots of observations vs predictions • Statistics: • Normalized Mean Bias (NMB) / Fractional Bias (FB) • Normalized Mean Error (NME) / Fractional Error (FE) • Root Mean Square Error (RMSE)
Highlights of 2002 Model Evaluation for CAPs • Ozone • Under predicted for 1-hr and 8-hr daily max. especially O3 > 60 ppb • Similar to performance for 2001 platform • Sulfate PM • Under predicted (~up to 25%) for all seasons in the East and West • Similar to performance for 2001 platform • Sulfur Dioxide • Over predicted (~35 to >100%) in all seasons in the East and West • Similar to performance for 2001 platform • Sulfate Wet Deposition • Under predicted (~10 to 25%) in the Winter and Fall and over predicted (~10%) in the Spring and Summer in the East • Under predicted (~13 to 45%) in the Spring, Summer, and Fall and over predicted in the Winter in the West
Highlights of 2002 Model Evaluation for CAPs • Nitrate PM • Over predicted (~30 to > 100%) in the Fall, Winter, and in northern areas of the East in the Spring • Significantly different than performance for 2001 platform • Nitrogen Wet Deposition • Under predicted (~10 to 70%) in all seasons in the East and West • Similar to performance for 2001 platform • Organic PM • Over predicted in the North and under predicted in South and West in the Winter • Under predicted in all areas (~25 to 65%) in Fall, Spring, and Summer • Similar to performance for 2001 platform • Elemental Carbon • Mostly over predicted in urban areas (~45 to >100%) in all seasons in the East and West • Mostly under predicted in rural areas (0 to >35%) in all seasons in the East and West • Similar to performance for 2001 platform
Winter Nitrate PM 12-km EUS - 2001 12-km EUS - 2002
Multi-Pollutant (CAP+HAP) CMAQ Runs • Initial 36 km nationwide annual run completed (12km Eastern US is underway) • Model evaluation underway- Initial run results indicate the need to more fully understand ambient toxics data in terms of the proximity of monitors to sources and the sampling time of measurements • Initial comparison with CAP-only results for select species
CAP+HAP vs CAP-only differences • Emission Differences- • Use HAPs for speciation for select sources • Use formaldehyde, acetaldehyde and methanol for all sources • Very small spatial/temporal profile differences in some geographic areas • Model Differences- • Chlorine chemistry • Added air toxics • Differences in Predictions- • Slight differences in Summer & Winter Ozone (Northeast, CA, UT) • Slight differences in Winter NO3 (Northeast, GA, UT) • Negligible differences in Summer SO4 • Some differences in Winter & Summer Formaldehyde & Acetaldehyde
2002 July Ozone: CAP+HAP – CAP-only • July: CAP+HAP slightly less ozone in Northeast, more ozone in Utah in vicinity of large source of chlorine emissions.
8hr max Ozone: CAP+HAP – CAP-only July 23, 2002 July 8, 2002
2002 January Ozone: CAP+HAP – CAP-only • January: more prominent impacts for Utah source, larger geographic area in which CAP+HAP ozone less than CAP-only ozone.
2002 January Nitrate PM: CAP-only vs CAP+HAP CAP+HAPs – CAPs CAP
CMAQ CAP FORM 2002 January Formaldehyde: CAP+HAP – CAP-only Difference in CMAQ FORM Difference in FORM Emissions • CMAQ differences in winter appear to be due to differences in speciation of residential wood combustion CAP VOC vs formaldehyde in the HAP inventory (CAP << HAP)
CMAQ CAP FORM 2002 July Formaldehyde: CAP+HAP – CAP-only Difference in CMAQ FORM Difference in FORM Emissions • CMAQ differences in summer appear to be due to differences in formaldehyde computed from wildfires (CAP+HAP) vs speciated from VOC (CAP-only)
Acetaldehyde – 2002 Winter Examples of Model Evaluation Formaldehyde – 2002 Annual NMB = - 23.1% NME = 51.5% NMB = - 35.5% NME = 48.3%
Future Efforts • Continue model evaluation efforts and investigate performance issues in conjunction with ORD • Prepare Multi-Pollutant Model Evaluation Report – Fall 2007 • Provide feedback to the 2008 NEI integrated inventory process and future modeling platform