Download
1 / 38
380 likes | 523 Views
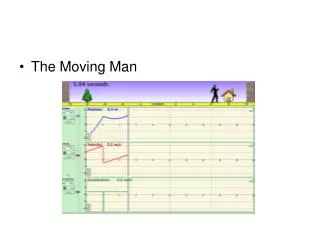
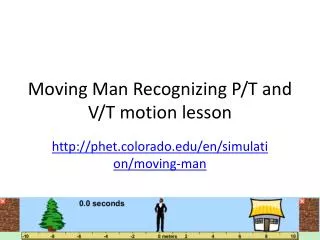
Moving Man Recognizing P/T and V/T motion lesson. http:// phet.colorado.edu/en/simulation/moving-man. P/T Graphs (Position/Time). Position and displacement are the same thing A position time graph shows your displacement over time. If the line goes up you moved forward

E N D
Moving Man Recognizing P/T and V/T motion lesson http://phet.colorado.edu/en/simulation/moving-man
P/T Graphs (Position/Time) • Position and displacement are the same thing • A position time graph shows your displacement over time. • If the line goes up you moved forward • and if it goes down you moved backwards. • If you get to a position less than 0m you are behind where you started. 15 10 P (m) 5 3 2 1 t (s)
P/T Graphs (Position/Time) 15 Slope 10 P (m) 5 3 2 1 t (s)
P/T Graphs (Position/Time) 15 Or Slope Slope 10 P (m) 5 3 2 1 t (s)
P/T Graphs (Position/Time) 15 Slope 10 d P (m) 5 t 3 2 1 t (s)
P/T Graphs (Position/Time) 15 Slope and 10 v P (m) 5 therefore 3 2 1 t (s)
P/T Graphs (Position/Time) The slope of a P/t graph equals velocity 15 10 P (m) 5 SlopeP/t 3 2 1 t (s)
P/T Graphs (Position/Time) • A position time graph shows displacement (or distance from an initial position) over time. • If the line goes up you moved forward and if it goes down you moved backwards. • If you get to a position less than 0 you are behind where you started
P/T Graphs (Position/Time) • constant forward motion • constant backward motion • constant acceleration • constant deceleration • no motion
P/T Graphs (Position/Time) 15 10 position P (m) 5 3 2 1 t (s) time
P/T Graphs (Position/Time) • constant forward motion 15 10 position P (m) 5 3 2 1 t (s) time
P/T Graphs (Position/Time) • constant forward motion 15 10 position P (m) 5 3 2 1 t (s) time
P/T Graphs (Position/Time) • constant backward motion 15 10 position P (m) 5 3 2 1 t (s) time
P/T Graphs (Position/Time) • constant backward motion 15 10 position P (m) 5 3 2 1 t (s) time
P/T Graphs (Position/Time) • constant acceleration 15 10 position P (m) 5 3 2 1 t (s) time
P/T Graphs (Position/Time) • constant acceleration 15 10 position P (m) 5 3 2 1 t (s) time
P/T Graphs (Position/Time) • constant deceleration 15 10 position P (m) 5 3 2 1 t (s) time
P/T Graphs (Position/Time) • constant deceleration 15 10 position P (m) 5 3 2 1 t (s) time
P/T Graphs (Position/Time) • no motion 15 10 position P (m) 5 3 2 1 t (s) time
P/T Graphs (Position/Time) • no motion 15 10 position P (m) 5 3 2 1 t (s) time
P/T Graphs (Position/Time) 15 10 position P (m) 5 3 2 1 t (s) time
New V/T Graphs (Velocity/Time) • Shows your change in velocity over time 10 5 velocity V (m/s) 0 -5 3 2 1 t (s) Is this person moving? time
V/T Graphs (Velocity/Time) • Shows your change in velocity over time 10 5 velocity V (m/s) 0 -5 3 2 1 t (s) Yes, at a constant velocity of 5 m/s time
V/T Graphs (Velocity/Time) Slope 10 and a 5 velocity therefore V (m/s) 0 -5 3 2 1 t (s) time
V/T Graphs (Velocity/Time) Slope 10 and a 5 velocity therefore V (m/s) 0 -5 3 2 1 t (s) time
V/T Graphs (Velocity/Time) 10 SlopeV/t 5 velocity V (m/s) 0 -5 3 2 1 t (s) time
V/T Graphs (Velocity/Time) Lets look at this in action
V/T Graphs (Velocity/Time) Examples: • constant forward motion • constant backward motion • constant acceleration • constant deceleration • no motion
V/T Graphs (Velocity/Time) • constant forward motion 10 5 velocity V (m/s) 0 -5 3 2 1 t (s) time
V/T Graphs (Velocity/Time) • constant backward motion 10 5 velocity V (m/s) 0 -5 3 2 1 t (s) time
V/T Graphs (Velocity/Time) • constant backward motion 10 5 velocity V (m/s) 0 -5 3 2 1 t (s) time
V/T Graphs (Velocity/Time) • constant acceleration 10 5 velocity V (m/s) 0 -5 3 2 1 t (s) time
V/T Graphs (Velocity/Time) • constant acceleration 10 5 velocity V (m/s) 0 -5 3 2 1 t (s) time
V/T Graphs (Velocity/Time) • constant deceleration 10 5 velocity V (m/s) 0 -5 3 2 1 t (s) time
V/T Graphs (Velocity/Time) • constant deceleration 10 5 velocity V (m/s) 0 -5 3 2 1 t (s) time
V/T Graphs (Velocity/Time) • no motion 10 5 velocity V (m/s) 0 -5 3 2 1 t (s) time
V/T Graphs (Velocity/Time) • no motion 10 5 velocity V (m/s) 0 -5 3 2 1 t (s) time
V/T Graphs (Velocity/Time) 10 5 velocity V (m/s) 0 -5 3 2 1 t (s) time