Download
1 / 9
90 likes | 179 Views
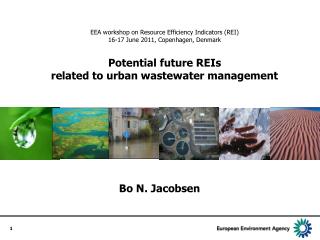
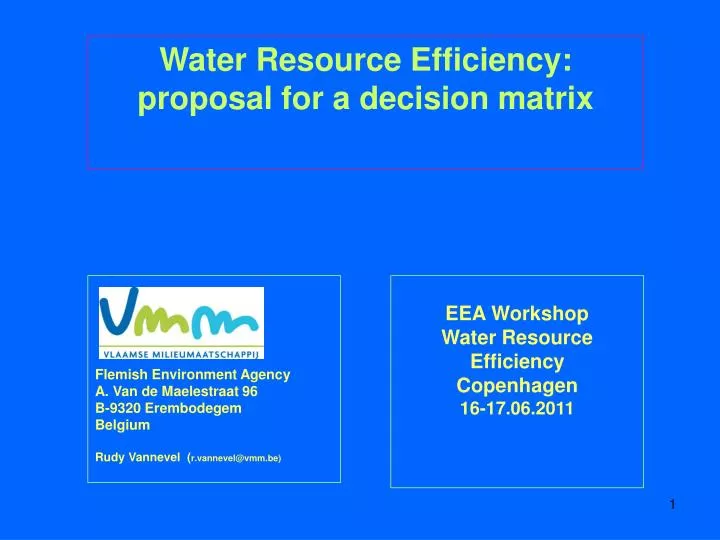
Water Resource Efficiency: proposal for a decision matrix. Flemish Environment Agency A. Van de Maelestraat 96 B-9320 Erembodegem Belgium Rudy Vannevel ( r.vannevel@vmm.be). EEA Workshop Water Resource Efficiency Copenhagen 16-17.06.2011. Challenges ResEff.

E N D
Water Resource Efficiency: proposal for a decision matrix Flemish Environment Agency A. Van de Maelestraat 96 B-9320 Erembodegem Belgium Rudy Vannevel (r.vannevel@vmm.be) EEA Workshop Water Resource Efficiency Copenhagen 16-17.06.2011
Challenges ResEff • How to be effective in decision-making? • How to relate Environmental Analysis & Policy (application & development)?
ResEff. Agriculture (BE-FL) (volumes in mio m³/y) P. Precipitation Indicator: sustainable w.use S. Agriculture (Production:….) P. Precipitation (Graph. trend 1990-2010) RH. Harvested rainwater (Graph. trend ) RH. Harvested Rainwater Potential: 0.8 m³/m²/y WU. Agriculture (Graph. trend 2005-2008) SW. Total Water stress 25 % L. Land WU. Water Use 100% = 48.2 1480 applied W.saving techniques 113 applied WWT techniques 4 % SW. Surface water 1.5 % Arable farming 38 % Impact sector on SW 3.3 % Vegetables (open air) 28 % 1.0 % Fruit (open air) 39 % 12 % 18.3 % Vegetables + fruit (greenhouse) 67 % DW. Drinking water 18.0 % Ornamental plant cultivation 62 % 19 % 15.3 % Dairy cattle GW. Groundwater 6.4 % Meat cattle 25 % 16 % 22 % 17.4 % Pigs GW. ‘Superficial’ 22 % 20.7 % Other farms GW. Deep layers 40 % Indicator. Sustainable water use [= Σ (RH, SW, GWsup) / Total] GW. Total Water stress Impact sector on GW
ResEff. NV CB (BE-FL, 2011) (volumes in mio m³/y) IP. Industrial plant CB (Production: 100.000 t/y citric acid) P. Precipitation GW. Ground water L. Land Costs. Private investment Costs. Subsidies FL gov. WAb. Abstraction CB ≤ 2010 / WAb. Other IPs UWWTP. Tienen Costs. Total costs / 2011 ≥ WAb. Cooling WReU. Cooling Other sources Drinking water: Products: Brownfield sanit.: 2010: ≤ 2010 / 2010: SW treatment Wprocess. Production Wprocess. Cooling Loss: Loss: IWWTP. CB IWWTP. CB SW. Surface water E! WW treatment Effluent cooling
ResEff. NV CB (BE-FL, 2011) (volumes in mio m³/y) GW. Total Water stress SoE effect of regulation Response effect of regulation Return of investment Policy instrument : subsidies Env Impact./Res. Indic. Policy indic. IP. Industrial plant CB (Production: 100.000 t/y citric acid) GW. Abstractions (Graph. trend 1994-2010) P. Precipitation 733 mm/y GW. levies (Graph. trend 1992-2010) Applic. Regulating abstraction levies? (Y) GW. Ground water Status: vulnerable GW level: # m L. Land GW. Abstraction CB (Graph. trend 1992-2010) Costs. Private investment 40 % = # mio € Costs. Subsidies FL gov. 60% = # mio € WAb. Abstraction CB Permit ≤ 2010: 3.7 Cooling Permit ≥ 2009: 0.8 Process ≤ 2010 / < 2010: 1.7 2010: 0.45 2011: 0.0 WAb. Other IPs > 0.5 UWWTP. Tienen Capac. 26.100 i.e Q effluent: 3.2 Costs. Total costs 1.1 mio € Impact IP on GW / 2011 ≥ 2010: 0.8 2011: 1.7 WAb. Cooling 2010: 1.2 2011: 1.7 WReU. Cooling 2010: 1.0 2011: 1.0 Other sources Drinking water: 0.03 Products: 0.03 Brownfield sanit.: 0.40 2010: 2.4 ≤ 2010 / 2010: 0.50 2010: 0.47 SW treatment Re-used WW SW. Total Water stress Wprocess. Production 2010: 0.97 Wprocess. Cooling 2010: 2.2 SW. Flows (Graph. Flow trend 1994-2009 in m³/y) Loss 2010: 0.18 Loss 2010: 0.02 IWWTP. CB 2010: 0.76 IWWTP. CB 2010: 2.2 SW. Surface water > 3.5 Impact on other resources Impact IP on SW E! WW treatment Effluent cooling
ENVIRONMENTAL ANALYSIS Policy & Management Instruments Water Chain-System (Sectoral analysis, w.Qnt & W.Qlt, Disturbances, Spatial assessments) Table EnvAn. Environmental Analysis Governance: current P&M EU Dir: WFD D P S I R Thematic (EUR) P-S, Morphological alterations, W.Use, WWT Geographic (EUR) Coastal Wbs, Vulnerable areas, Transboundary Wbs REPORT CONTENT: SoWater 2012 / Blueprint 2012 DPSIR Disturbances (EUR) Eutrophication, Sediments, Biodiversity, Recreation, Health Country examples (BE-FL) Sediment Qlt, Manure Action Plan, Invasive spp, Fish migration, Over-pumping dune areas Reporting Indicators, information, data & information gaps,… Governance: new P&M ES services, W.accounting, CC, Resource efficiency, health & sanitation, biodiversity,… POLICY DEVELOPMENT FRAMEWORKS DPSIR Governance CAPs ESs EIC PLAN CONTENT Resource Efficiency Table ResEff. Resource Efficiency Policy options
ENVIRONMENTAL ANALYSIS – Resource Efficiency Policy & Management Instruments Water Chain-System > Sectoral analysis > Energy Governance: current P&M ?? D P S DPSIR I R Reporting ?? Governance: new P&M
POLICY DEVELOPMENT FRAMEWORKS DPSIR Governance CAPs ESs EIC Resource Efficiency Policy options
ENVIRONMENTAL ANALYSIS Policy & Management Instruments Water Chain-System Governance: current P&M D P S I R Table EnvAn. Environmental Analysis REPORT CONTENT DPSIR Policy evaluations Thematic assessments Reporting Assessments & outlooks Governance: new P&M P&M topics POLICY DEVELOPMENT FRAMEWORKS Table ResEff. Resource Efficiency DPSIR Governance CAPs ESs EIC PLAN CONTENT P&M topics Actions Policy options Implementation