Download

1 / 36
360 likes | 462 Views
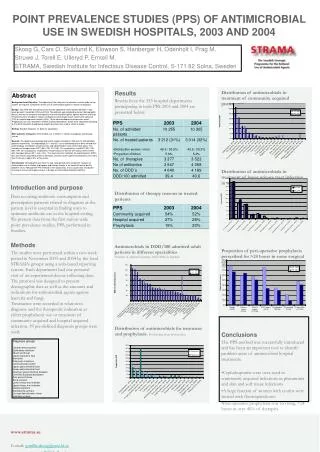
Explore the patterns of antibiotic use, quality measures, and potential areas for improvement in antimicrobial prescribing in acute sector hospitals based on the 2012 survey data. Identifying age groups, gender variations, indications for prescribing, and surgical prophylaxis practices.

E N D
Antimicrobial use in the2012 PPS 3rd May 2012 Robin A Howe Antimicrobial use in Primary Care
PPS 2011 • Broadly similar to previous surveys of 2008/09/10 • Mandated by WG – greater coverage, esp. smaller hospitals • Based on ESAC methods • New indications, specialties, diagnosis sites
Diagnosis sites Rational Antimicrobial Use
What can we get from the PPS? • Understand the pattern of antibiotic use • Describe potential measures of quality • Identify areas for potential further investigation or improvement
2494/9094 (27.4%) receiving an antimicrobial • 2008 – 31% • 2009 – 29.5% • 2010 – 30% • 2011 – 30% (antibacterials in 37 comparator hospitals)
A: Bronglais B: Princess of Wales C: Royal Glamorgan D: Royal Gwent E: Morriston F: UHW G: Withybush H: Wrexham Maelor J:Glangwili K: Ysbyty Gwynedd L: YsbytyGlan Clwyd M: Nevill Hall N: Prince Charles P: Llandough R: Prince Philip S; Singleton T: Neath Port Talbot AB use - acute hospitals Rational Antimicrobial Use
A: Bronglais B: Princess of Wales C: Royal Glamorgan D: Royal Gwent E: Morriston F: UHW G: Withybush H: Wrexham Maelor J:Glangwili K: Ysbyty Gwynedd L: YsbytyGlan Clwyd M: Nevill Hall N: Prince Charles P: Llandough R: Prince Philip S; Singleton T: Neath Port Talbot AB use – acute hospitals Rational Antimicrobial Use
Antibacterial prescribing by indication/ specialty in the Acute Sector Rational Antimicrobial Use
Antibacterial prescribing by indication/ hospital in the Acute Sector Rational Antimicrobial Use
Number of antibacterials prescribed per patient by specialty in Acute Sector Rational Antimicrobial Use
Number of antibacterials prescribed per patient by hospital/sector Rational Antimicrobial Use
Antibacterial prescribing by route and specialty in Acute Sector Rational Antimicrobial Use
Antibacterial prescribing by route for acute sector hospitals Rational Antimicrobial Use
Reason for antimicrobial prescription was recorded in notes by sector and specialty (%). Rational Antimicrobial Use
Surgical prophylaxis >1 day by diagnosis group (%) 2008-2010 ENT Rational Antimicrobial Use
Areas for investigation/ improvement
Diagnoses for piperacillin/tazobactam plus metronidazole prescribing (n=42)
Antibacterial regimens (%) for CA-RTI 2010-2011 • High rate of “other” • CLA use decreasing • DOX increasing • PTZ + MTZ increasing
Antibacterial regimens (%) for HA-RTI 2010-2011 • Decreasing “other” • Increasing PTZ • Increasing DOX • Decreasing AMO
Antibacterial regimens (%) for CA-UTI 2010-2011 • Consistent prescribing • Increasing CIP
Antibacterial regimens (%) for HA-Cys 2010-2011 • Surprisingly high TMP use
Antibacterial regimens (%) for CA-SSTBJI 2010-2011 • V high “others” • Significant FLU + PEN
Antibacterial regimens for HA-SSTBJI 55 different regimens ?CHAOTIC?
Clostridium difficile regimens 2010 & 2011 (%) 12% for >10 days (14.3% in 2010) (19.6% in 2009)
Overall 8.8% of patients surveyed were being treated for a hospital acquired infection only, as deemed by the prescriber. • Only 4.0% of patients were considered to have a HAI as defined by the HAI case definitions within the survey.
Conclusions • Antibiotic use has not materially changed (~30% in-patients) • Use varies across acute sector hospitals (24-41%) • Quality measures show variability • PO/IV • Recording • Surgical prophylaxis • Areas for study/improvement • C. difficile treatment • Antimicrobial guidance/adherence • Discrepancy between diagnosis and treatment of HAI