Download
1 / 32
320 likes | 340 Views
This report examines the historical impact of Central Valley Project (CVP) and State Water Project (SWP) salvage on Chinook salmon, steelhead rainbow trout, and striped bass in the southern Delta. It analyzes loss estimates and identifies the potential impacts of increased water exports. The report also addresses the controversy surrounding the protection of striped bass and the effectiveness of fish facilities.

E N D
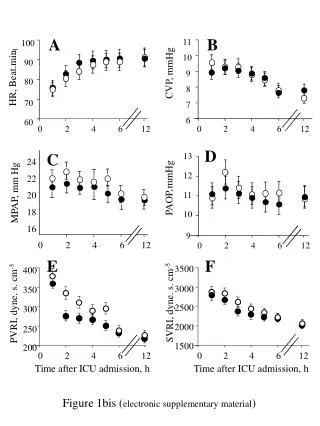
Historical CVP and SWP Salvage and OCAP Loss Estimates Chinook Salmon, Steelhead Rainbow Trout, and Striped Bass Project Impacts in the southern Delta DeltaKeeper prepared by Dan B. Odenweller
CVP and SWP Annual Exports • CVP from 1957 to 2002 (Water Year) • SWP from 1968 to 2002 (Water Year) • 8500cfs Level of Operation could add up to 1Million Acre/Feet of Additional Exports.
CHINOOK SALMON USBR (CVP) • CVP data from 1957 to 2002 (Water Year) • Note heavy CVP salvage in the 1957 to 1967 period (pre-SWP), but continuing to 1976 (1976-77 drought) CDWR (SWP) • SWP data from 1968 to 2002 (Water Year) • Note the peak salvage in 1986, a wet year.
STEELHEAD RAINBOW TROUT USBR (CVP) • CVP data from 1979 to 2002 (Water Year) • Identification prior to 1979 considered unreliable CDWR (SWP) • SWP data from 1968 to 2002 (Water Year) • Note the peak in 1982.
CS and STH Catch per Unit Effort(Salvage per Acre Foot) • Data is on a Water Year Basis • Expressed as Fish per Acre-Foot
Chinook Salmon OCAP Loss per Unit Effort(OCAP Incidental Take per Acre Foot) • Again, on a Water Year Basis • Expressed as Fish per Acre Foot USBR (CVP) • CVP - All Years Calculated with 0.15 Pre-screen Loss • CVP - All Years Calculated with 0.25 Screen Loss CDWR (CVP) • SWP - 1968 to 1971 Calculated with 0.15 Pre-screen Loss • SWP - 1972 to Date Calculated with 0.75 Pre-Screen Loss • SWP - All Years Calculated with 0.25 Screen Loss
THE DIRECT LOSS CALCULATION MODEL • Methodology taken directly from the OCAP Biological Assessment and Biological Opinion. • CVP assumes a 0.15 Pre-Screen Loss and a 0.25 Screen Loss factor for all years. • SWP assumes a 0.15 Pre-Screen Loss and a 0.25 Screen Loss factor for 1968 to 1971 (no CCFB); and • then assumes a 0.75 Pre-Screen Loss factor for 1972 to present, to account for CCFB losses.
The Striped Bass Dilemma • The indicator species for the Estuary in SWRCB D1379 and D 1485. • Specifically targeted for “doubling” in the CVPIA (PL 102-575). To date, no consideration for striped bass, or for sturgeon, American shad, steelhead, and other anadromous fishes as required by statute. • Economically important commercial (until 1935) and sport fish, introduced into the Estuary in 1879 from the East coast.
The Striped Bass Index • Data collected by DFG since 1958, with a few exceptions. • Decline has been continuous, “goals” were: • SBI = 120 “Historical Levels” - circa D 1379 • SBI = 65 “Recent Historical Levels” - circa D 1485 • SBI = >10 “Post 1976-77 Drought Levels” - circa D 1681 • SBI = <10 Since 1995, coincident with CalFed actions described earlier in the workshops, for WRCS and DS. • How is this Public Trust Resource (or Beneficial Use) receiving “due process” under the present scheme?
Striped Bass South Delta Salvage • CVP and SWP fish protective facilities have recorded fish salvage since they began operations. • Striped bass were one of the key species which the fish facilities were developed for. • CVP records 1958 to date (1991-1996 gap is in my data set). • SWP records 1968 to date (1991-1996 gap is in my data set).
The SWP Mitigation Calculation(4-Pumps) • Standard methodology used by CDFG to calculate the number of “yearling equivalents” owed. • Losses normalized to address each life stage on a common basis. • For striped bass, a management decision to use mean of years monitored in place of an annual survey (beginning in 1996), has generated cost savings - and a loss of priceless information.
Handling and Trucking Losses • Studies of the production process by Raquel (1989). • Losses varied by species, size, and water temperature: Net • Chinook Salmon = 2% • Steelhead Rainbow Trout = 0% • Striped Bass = 1 - 84% • American Shad = 0 - 100% • Threadfin Shad = 0 - 66% • White Catfish = 0 - 75% (Smaller sizes and higher water temperatures = higher losses)
CVP-SWP South Delta Fish Facilities • CVP (USBR) facility dates from 1957, the SWP (DWR) facility dates from 1967. • Neither facility was designed to meet current protection goals. Research program and upgraded facilities part of the “Delta Accord,” and “CalFed ROD.” • Water users now argue that these “assurances” cost too much, but there has been no economic analysis of the cost vs. the benefits of export level increases.
DeltaKeeper and CSPA are not prepared to agree to additional increases in exports until these concerns are resolved.
The End Image by Virginia Afentoulis