Download
1 / 25
250 likes | 297 Views
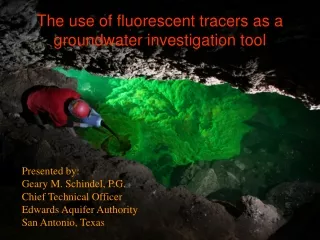
The use of fire simulation as a tool for regulation evolution application to Heat Release Rate (OSU) requirements. Serge LE NEVE / Camille RIERA / Antoine ORTH. Serge LE NEVE E-mail : Serge.le-neve@intradef.gouv.fr.

E N D
The use of fire simulation as a tool for regulation evolution application to Heat Release Rate (OSU) requirements Serge LE NEVE / Camille RIERA / Antoine ORTH Serge LE NEVE E-mail : Serge.le-neve@intradef.gouv.fr 8th Triennial International Aircraft Fire and Cabin Safety Research Conference October 24-27, 2016 / Atlantic City, NJ
Cabin safety in case of post crash fire • It is essential to sustain survivable conditions long enough to evacuate the aircraft, • Evacuation time widely depends on fire growth and propagation inside the cabin before reaching flash-over conditions. • Currently, real scale testing is the most reliable way to estimate the fire growth rate and time to flash-over, • Experimental way is widely used by aircraft Authorities to assess the effect of new materials introduction: • On fire risk and cabin safety, • To justify evolutions in the regulation. • Full scale testing is not always possible both for time and cost reasons, • 1 test alone, only validates the cabin layout configuration tested, • Several / many tests are needed to assess the effect of various parameters on time to flash-over.
Why simulation? Only needs computing time, Eliminates fire risk, except in case of CPU over-heat…, No needs to present any safety analysis to the management before test campaign …, Computers can work night and day! Computing time is much longer than time to flash-over…, but needs much less time to clean, prepare and run the following test. But requires • Scientist team well informed of: • The phenomena that they want to simulate, • The limitations and weaknesses of their codes, • Sensibility of the codes to all the input data. • Time (and experience) to design reliable simplified test configurations and methodologies (real test configurations are rarely easy to compute).
Simulation at DGA AS Validation of numerical approach based on experimental data Full scale fire test Numerical simulation to calculate the fire growth : • Room of 75 m3 (5 x 5 x 3) • Ceiling & side walls made of composite material • Fire source : Heptane pool fire (860 kW) • 2 test configurations : • Covered or un-covered bulkheads (side walls & ceiling)
Validation data • Correlation simulation / experiment on covered sidewalls & ceiling configuration: Simulation result Sidewalls and ceiling covered by painted material Ignition T° : 150°C Experimental data Extinguishment Good estimation of time to flash-over • Over-estimation of T°
Validation data • Correlation simulation / experiment on uncovered configuration Simulation result Sidewalls and ceiling panels only Ignition T° : 350°C Experimental data Good correlation • Progressive fire growth without flash-over • Good estimation of T°
Numerical simulation Effect of OSU requirements on time to flash-over • Framework / Scope • Objectives & limitations of this simulation • Numerical approach • Simplified test configuration • Definition of layout configurations to be calculated • Numerical results • Conclusion
Framework / Scope • Lower parts are involved lately in the fire growth cycle • Their HRR characteristics are supposed to have a limited effect on the time to flash-over • For cost and technical reasons it would be interesting for aircraft manufacturers to suppress the HRR (Heat Release Rate) requirement for materials located in the lower part of the cabin sidewalls • This talk presents a work that DGA carried out mainly within the framework of the ARAC MFWG committee: • to better quantify contribution of the lower parts on the fire growth kinetic • to estimate the effect of various heights of an OSU transition zone* on cabin safety • * height below which there would be no OSU requirement anymore
Objectives & Limitations • Computational approach realised with the CFD code FDS v5.5 • Simplified geometry of a medium range aircraft cabin (A320 / B737) • Due to several hypothesis, simplifications and uncertainties of the simulation code, this approach: • does not claim to be able to predict the time to flash-over, • only valid to assess the trends / effects of an OSU transition zone on the evolution of the time to flash-over (in comparison with some relevant configurations supposed to be majoring or reference configurations).
Test configuration T° measurements • Wall characteristics • Insulation material • Non-combustible material • Fire source (375 kW) • (Kerosine) • Pool fire : 0,5 x 0,5 m • 1500 kW/m² « GYPSUM PLASTER » Specific Heat = 0.84 kJ/kg/K Conductivity = 0.048 W/m/K Density = 1440 kg/m3.
Numericalapproach • Cabin ceiling & sidewalls are covered with materials, with a given HRR profile • Fire source applied for 500s • Heat released by the fire source increases: • T° inside cabin • Surface T° of ceiling & sidewall materials • Materials ignite when their surface T° reach ignition T°: • provide additional heat release according to their HRR profile • Cabin T° and Total Heat Release are computed in order to calculate the fire growth and determine the flash-over conditions
Preliminary tests In order to define majorant fire profile allowed by the regulation: - basic profiles of heat release rate were used on all surfaces (sidewalls and ceiling) to assess the effects of time to HRR peak on the time to flash-over Typical profiles were defined with the maximum Heat Release allowed by the rule (HRR peak (5mn) / Total HR (2mn))
Preliminary tests Effect of various HRR profiles on calculated fire growth • Flashover occurs sooner in case of a material having an earlier peak of heat release (P2 profile). • Curve P4 shows that the heat release rate after 2 mn has an effect on the intensity of the fire. The effect on time to flash-over is not significant. • Cabin safety point of view : • The fire generated by the HRR profile P2 is to be considered as the “majorant regulatory fire profile” regarding the time to flashover (time available for passengers to evacuate the aircraft)
Calculation of a baselinefire profile Selection of a real “just compliant” HRR profile • HRR profile P2 is not a realistic profile : • We selected a real profile in our data base in accordance with the previous findings : • An early peak of HRR (65 kW/m²) • A total HRR (2mn) close to 65 kw.mn/m² (max value allowed by the rule) • The fire growth calculated from this profile will represent the baseline fire profile intended to be representative of a real “just compliant” cabin layout configuration
Calculation of a baselinefire profile To be as representative as possible, size of the pool fire were defined to lead to flash-over conditions at ≈ 4mn after ignition, With all sides and ceiling covered by just OSU compliant material (65/65) Inner sides / Cabin layout materials « COMPLIANT » Specific Heat = 1.0 kJ/kg/K Conductivity = 0.5 W/m/K Density = 400 kg/m3. • Fire source (375 kW) • (Kerosine) • Pool fire : 0,5 x 0,5 m • 1500 kW/m²
Calculation of a baseline fire profile Comparison of the 2 reference fires • Majorant regulatory fire (not realistic but giving the earliest time to flashover allowed by the rule) • Baseline fire (from a realistic just compliant material) • In the following slides we will compare fire profiles from various cabin layout configurations (various heights of OSU transition zone) to these reference profiles, • in order to estimate the effect of OSU transition height on the flash-over conditions
Selection of a « bad material » OSU profile • Previous calculations clearly showed a significant effect of the time position of the Heat Release Peek. Thus, to avoid an effect only due to the position of the HR Peak : • Bad material and “just compliant” material should have their HR peak at the same time position, • Ideally, their HRR profiles should be as similar as possible • Material have to be as bad as possible, while remaining realistic, • Bad material have been selected in our tests data base • Real profile is slightly modified to be similar (in shape) to the baseline material (just compliant material)
Fire simulation of mixed configurations • 2 previous materials used as sidewalls and ceiling materials to simulate different fires inside cabin • Tested configurations will only differ in the heights of the OSU transition zone applied to the sidewall “Just Compliant” material HRR Profile (65/62) “Bad” material HRR Profile (210/227)
Fire simulation of mixed configurations • 3 heights of OSU transition line applied on sidewalls • Calculated fire growths compared to Baseline fire (Blue) and Majorant regulatory fire (Red) No significant effect up to 18 inches
Fire simulation of mixed configurations • 3 heights of OSU transition line applied on sidewalls • Calculated fire growths compared to Baseline fire No significant effect up to 18 inches 18 inches Majorant régulatory Fire 10 inches 36 inches Majorant régulatory Fire Baseline Fire (just OSU compliant Material) Baseline Fire (just OSU compliant Material)
What would be the effect of a more realistic aircraft cabin definition? • Earlier time to flash over • But no longer visible effect of OSU transition heights • Ceiling areas heat quicker, • Heat is trapped in narrow areas, • More materials are involved in fire before materials below the OSU transition line ignite • (flash-over occurs before the “bad materials” are involved in the fire)
What would be the effect of smoke ? • Effect of smoke heat radiation • 1 case computed (transition line 18 Inches) taking into account smoke released from pool fire (kerosine) • No effect of smoke showed by simulation ? • In a real case, if smoke has an effect, heat radiation from soot should lead to an earlier flash-over • (flash-over would occur before “bad materials” would be involved in fire)
Fire simulation of mixed configurations Conclusion • The numerical approach carried out is able to assess the effect of an OSU transition line on cabin safety with a good level of reliability, • Fire growth computations as shown that the effect of an OSU transition line (up to 18 inches) on the time to flash-over is not significant, • In case the transition zone is at 36 inches, the fire growth began to be faster, but the safety marge is still significant in comparison with the growth of the majoring regulatory fire.
Conclusion • Knowing the limits of the code and thanks to a relevant choice of configurations, associated with relevant input data : • Fire numerical simulations of simplified configurations can provide to engineers and authorities confident data and can constitute an helpful decision-making tool.
The use of fire simulation as a tool for regulation evolution application to Heat Release Rate (OSU) requirements 8th Triennial International Aircraft Fire and Cabin Safety Research Conference October 24-27, 2016 / Atlantic City, NJ