Download

1 / 1
10 likes | 155 Views
A. Figure 4 : Experimental setup: (1) DSO (2) Computer (3) Relay (4) Contacts (5) AC Voltage Supplier. Figure 3. (a) Energy dispersion of graphene p -band, (b) Electronic band structure of a (4,2) nanotube, (c) Density of states of the electronic band diagram.

E N D
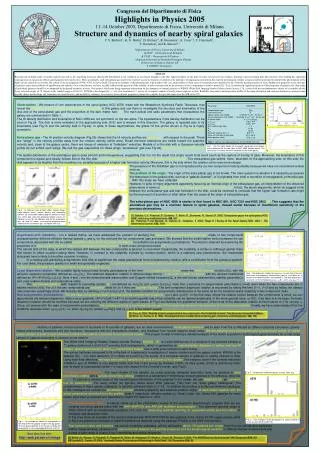
A Figure 4: Experimental setup: (1) DSO (2) Computer (3) Relay (4) Contacts (5) AC Voltage Supplier. Figure 3. (a) Energy dispersion of graphene p-band, (b) Electronic band structure of a (4,2) nanotube, (c) Density of states of the electronic band diagram. Figure 2. (a) The unrolled honeycomb lattice of nanotube, (b) SWNT (n,m)=(4,2) Congresso del Dipartimento di Fisica Highlights in Physics 2005 11–14 October 2005, Dipartimento di Fisica, Università di Milano Quantum transport in carbon nanotubes M. Baxendale*, M. Melli*,† and I. E. Pollini† * Department of Physics, Queen Mary, University of London, London , UK † Dipartimento di Fisica, Università degli Studi Milano, 20133 Milano, Italy INTRODUCTION In the last twenty years, due to technological advances, it has become possible to build, manipulate and observe nanometer structures whose dimensions are intermediate between the microscopic and macroscopic. These new systems present novel features and have originated the new field of mesoscopic physics. As for the transport properties the mesoscopic conductors do not have ohmic behaviour and the free mean path of electrons is longer than the conductor length in some systems. In this case the conductor is called ballistic, i. e. the electron can travel without scattering in the bulk of the conductor. Another significant consequence of the conductor low dimensionality is that its conductance G = I /V is quantized. The current approach to describe these phenomena is the “transmission formalism” introduced by Landauer: the current through a conductor is given by the probability that an electron can transmit through it. The fundamental equation of the Landauer-Büttiker theory [1] is where G0=2e2/h(12.9 kW)-1 is the fundamental quantum unit of conductance, and Tabis the transmission probability for an electron to go from channel a to channel b. Carbon nanotubes (CNT), which are typically 1 to 5 nm wide and 1 to 10 mm long, are ideal systems to proof the theories about the mesoscopic transport. The nature of the electronic transport in CNT is intriguing and still a matter of debate, and only a few experiments have shown the conductance quantization [2, 3] (see Figure 1). In this work we present new transport data on CNT by means of the mechanically controllable break junction (MCBJ) technique. MCBJ experiments on bundles of carbon double wall nanotubes (DWNT) have been performed and signatures of quantum conductance (QC) have been observed in these systems. Figure 1. Carbon nanotube conductance measurements [2, 3] CARBON NANOTUBES Carbon single wall nanotubes (SWNT) are cylindrical macromolecules formed by periodic hexagonal structures of carbon atoms. The ends of NT are closed by hemispherical caps whose curvature is given by the presence of pentagonal rings. A significant feature of CNT is their dimension. Moreover, they possess unique mechanical and electrical properties summarized in Table I. SWNT are actually one-dimensional crystals with many atoms (up to thousands) in the primitive unit cells, and they can be described as a subset of a 2D graphene lattice. In fact SWNT can be seen as a single layer of graphite (graphene) warped into a cylinder. In this way, we have a simple description of the complex structure of NT and obtain, to first order, the electronic and phonon structures from the ones of the 2D graphite using the zone folding technique. The resulting NT are characterized by the chirality vector Ch, which joins the points O and Aof the unfolded graphenewhich are overlapped after the rolling up(see Figure 2). By introducing theprimitive lattice vectors of graphenea1and a2, the chirality vector can be expressed by them: Ch=na1+ma2, where n and m are two integers which conserve the honeycomb lattice structure.The chirality vector describes the structure of SWNT with the n and m integers used as indices of the tubes in order to express their geometrical properties. The electronic properties also depend on theindicesm, n : if n =m or n-m=3i, with i integer, the CNT is metallic and, in the other cases is semiconducting with the energy gap inversely proportional to the tube diameter . The analysis of the CNT structures shows that in metallic SWNT there are two sub-bands crossing at the Fermi level Ef (conduction channels), so that for the ballistic transport the conductance should be G=2G0. according to the Landauer-Büttinger equation. Another class of CNT is formed by the multi-wall nanotubes (MWNT), which are made by several coaxial shells. Their characterization is more difficult than that of SWNT because of interlayer interactions. It has been shown [2, 3] that the transport in MWNT can be ballistic and quantized like in the case of SWNT. A plausible hypothesis is that only the external shell contributes to the transport so that the conductance is supposed to be G=2G0, while it is found experimentallythat the quantum conductance (QC) is equal to 0.5 G0 or 1 G0. It isbelieved that these anomalous values of the QC is related to the structural properties of the NT and that its fractional QC, which may occur in MWNT, may be due to interwall interactions that modify the density of states (DOS) near the Ef. Looking at the DOS structure (see Figure 3) we see that the number of channels increases with energy and that for high voltages (in our case for values larger than 0.5 V) the conductance may become higher than 2 G0. Table I – Carbon nanotube spectacular properties EXPERIMENTAL SETUP AND RESULTS Figure 4 shows our experimental setup which is similar to that described by K. Hansen [4]. The gold contacts of the relay are opened and closed by the magnetic force of a coil driven by an AC voltage source and by the mechanical force of a spring. Powder of bundles of DWNT is stuck to the electrical contacts with silver-glue. A 8 bit digital storage oscilloscope (DSO) measures the voltage VDSO between the circuit points A and B. The DSO is set to trigger when the contacts are open and it then monitors the time-evolution of the voltage (cycle traces) with an appropriate time scale (ms). To obtain a high resolution the VDSO is measured on two input lines on the DSO with different V/div settings (0.1 and 0.02). The DSO is controlled by a PC, which accumulates the data of the cycle traces. The analysis is carried out with the technique of histograms. The voltage trace is converted into the conductance trace and accumulated in the histograms. The histograms values H (Gi) corresponding to the values of conductance (Gi, Gi+DGi) is defined by: where N is the total number of counts, Ni is the number of counts in bin number i and DGi is the conductance bin size. In every histogram we have collected up to 100,000 values of conductance.In our experiment we have used MWNT, which were very straight with typical lengths from 1 to 5 mm. A TEM image shows that single nanotubes protrude from bundles of densely packed CN. In Figure 6 we show the conductance histograms obtained at different bias voltages (0.37 to 1.35 V), where we note that the conductance range becomes wider and the histograms are more structured. Figure 6 (a) presents the conductance histograms at 0.37 V, where a broad peak located between 0.5 and 1 G0 is observed, and in Figure 6 (b) this peak broadens and is accompanied by a small shoulder near 0.5 G0 and a wide structure at higher values of G0. This structure observed at high voltages is due to excitations of higher energy sub-bands in the band structure diagram (see Figure 3). Then in Figures 6 (c) and 6 (d) the 0.5 G0 shoulder gets stronger and the following band becomes structured with a small peak around 1.5 G0 and a boad double-peaked band around 3 G0. Finally, in Figures 6 (e) and (f), we observe a narrow peak close to G0 accompanied by a wide band located at 3.5 G0. We think that the investigated DWNT show two different ballistic pathways which are characterized by values of the QC at 1 G0 and at higher values obtained by overlapping different conductance contributions between 2 G0 and 4 G0, which give rise to the observed wide structured band. In our measurements we have obtained a value of the QC equal to 1 G0 : we believe that this anomalous behaviour can arise from interwall interactions in the investigated DWNT. Figure 5. TEM image of the end of a bundle of CNT. REFERENCES CONCLUSIONS • R. Landauer, IBM J. Res. Dev. 1, 223 (1957); M. BüttikerIBM J. Res. Dev. 32, 63 ( 1988) • S. Frank et al.,‘Carbon nanotubes quantum resistors’, Science 280, 1744 (1998). • A. Urbina et al.,‘Quantum conductance steps in solutions of multiwalled carbon nanotubes’, Phys. Rev. Lett. 90, 106603 (2003). • K. Hansen et al.,‘Quantized conductance in relays’, Phys. Rev. B 56, 2208 (1997). The electronic states and the conductance of DWCN in absence of impurities have been experimentally investigated. We assume that scattering in the bulk is negligible and that the number of channels determines the average conductance in the ballistic regime. A major conclusion of our work is the realization that actually there are two types of ballistic pathways in the carbon nanotubes networks. The measured QC is equal to 0.5 and 1G0. This anomalous conductance quantization can arise from interwall interaction or antiresonance with edge states in the inner tube. The higher conductance values between 2 G0 and 4 G0 are due to excitations of higher energy sub-bands in the band structure diagram.Further theoretical and experimental studies at high voltages seems necessary to better understand the DWNT properties. (b) (a) (c) (d) (e) (f) Figure 6. Conductance histograms for different bias voltage: (a) 0.37 V (b) 0.58 V (c) 0.76 V (d) 0.96 V (e) 1.15 V (f) 1.35