Download
1 / 6
60 likes | 223 Views
The budget constraint. Consumers need income to buy goods and they must pay prices. These features limit what the consumer can have. Budget constraint or budget line.

E N D
The budget constraint Consumers need income to buy goods and they must pay prices. These features limit what the consumer can have.
Budget constraint or budget line • The budget constraint for an individual shows combinations of x and y that can be attained given a certain income and assuming prices must be paid for the goods. • The constraint will be a line in the graph we saw before – you know the one, the one where the amount of x is measured horizontally and the amount of y is measured vertically.
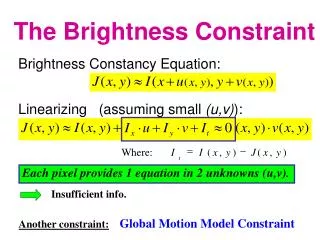
Budget constraint or budget line If I = the consumer income in dollars Px = the price per unit of x Py = the price per unit of y x = the amount of x the consumer buys y = the amount of y the consumer buys, then the amount the consumer buys is I = (Px)(x) + (Py)(y) or y = (I)/(Py) - [Px/Py](x) Note if x = 0, y = I/Py and if y = 0, x = I/Px and the slope of the line is - (Px)/(Py).
Budget constraint y (0, I/PY) -Px/Py This is the slope – a negative number. x (I/Px, 0)
Budget constraint The slope of the budget line is - Px/Py. Say x = a bag of chips and y = a can of pop. If Px = $1/bag and Py = .50/can, then - Px/Py = -($1/bag) ($.50/can) = - 2 cans/bag y 2 1 x The slope of the budget line indicates that if one bag of chips is given up, 2 cans of pop can be obtained in the market. This occurs at every point on the budget line when prices remain constant in relation to the amount bought.
slope Note on the previous screen that the slope of the budget line is telling us about how much good x is valued in the market in relation to good y. This implies that the slope of the budget is indicating the market rate of substitution of good x for good y. Remember the indifference curve slope was indicating how much of good x a person was willing to give up to get more of good y. The slope of the budget is the relative price of x.