Download
1 / 1
10 likes | 107 Views
Behavioral Paradigm. Easy Hard. +. V T. θ. ∫. -. - θ. V D. t + t ballistic = RT. Modeling interactions between visually responsive and movement related neurons in frontal eye field during saccade visual search. Easy search Hard search. Growth rate (sp/s/ms).

E N D
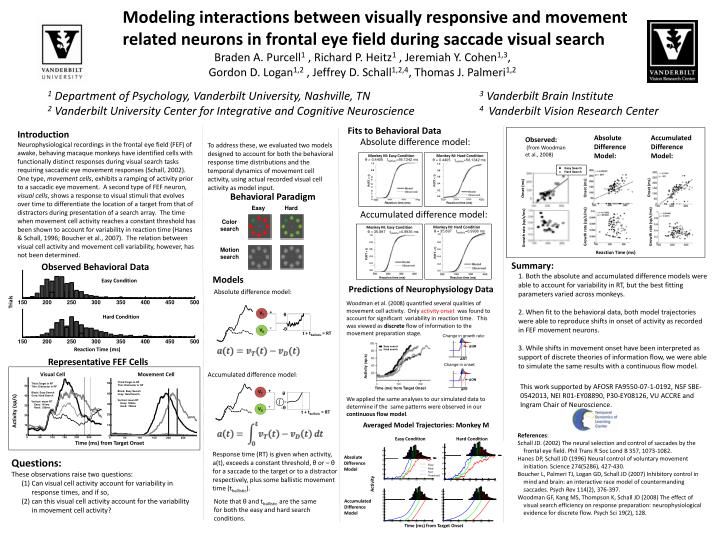
Behavioral Paradigm Easy Hard + VT θ ∫ - -θ VD t + tballistic = RT Modeling interactions between visually responsive and movement related neurons in frontal eye field during saccade visual search Easy search Hard search Growth rate (sp/s/ms) ΔGR Braden A. Purcell1 , Richard P. Heitz1 , Jeremiah Y. Cohen1,3, Gordon D. Logan1,2 , Jeffrey D. Schall1,2,4, Thomas J. Palmeri1,2 Activity (sp/s) Time (ms) from Target Onset 1 Department of Psychology, Vanderbilt University, Nashville, TN 3 Vanderbilt Brain Institute 2 Vanderbilt University Center for Integrative and Cognitive Neuroscience 4 Vanderbilt Vision Research Center ΔON ΔRT ΔRT Easy Search Hard Search Fits to Behavioral Data • Introduction • Neurophysiological recordings in the frontal eye field (FEF) of awake, behaving macaque monkeys have identified cells with functionally distinct responses during visual search tasks requiring saccadic eye movement responses (Schall, 2002). One type, movement cells, exhibits a ramping of activity prior to a saccadic eye movement. A second type of FEF neuron, visual cells, shows a response to visual stimuli that evolves over time to differentiate the location of a target from that of distractors during presentation of a search array. The time when movement cell activity reaches a constant threshold has been shown to account for variability in reaction time (Hanes & Schall, 1996; Boucher et al., 2007). The relation between visual cell activity and movement cell variability, however, has not been determined. To address these, we evaluated two models designed to account for both the behavioral response time distributions and the temporal dynamics of movement cell activity, using actual recorded visual cell activity as model input. Absolute Difference Model: Accumulated Difference Model: Observed: (from Woodman et al., 2008) Absolute difference model: Monkey M: Hard Condition Monkey M: Easy Condition θ = 0.4405 tballistic=56.1342 ms θ = 0.4405 tballistic=56.1342 ms 1.0 1.0 0.8 0.8 0.6 0.6 P(RT < t) P(RT < t) Onset (ms) Onset (ms) Onset (ms) 0.4 0.4 0.2 0.2 0.0 0.0 Reaction time (ms) Reaction time (ms) Accumulated difference model: Color search Motion search Growth rate (sp/s/ms) Growth rate (sp/s/ms) Monkey M: Hard Condition Monkey M: Easy Condition θ = 35.897 tballistic=0.9936 ms θ = 35.897 tballistic=0.9936 ms Reaction Time (ms) 1.0 1.0 Summary: 1. Both the absolute and accumulated difference models were able to account for variability in RT, but the best fitting parameters varied across monkeys. 2. When fit to the behavioral data, both model trajectories were able to reproduce shifts in onset of activity as recorded in FEF movement neurons. 3. While shifts in movement onset have been interpreted as support of discrete theories of information flow, we were able to simulate the same results with a continuous flow model. 0.8 0.8 0.6 0.6 Observed Behavioral Data P(RT < t) P(RT < t) Models 0.4 0.4 0.2 0.2 Predictions of Neurophysiology Data Absolute difference model: 0.0 0.0 Easy Condition Reaction time (ms) Reaction time (ms) Woodman et al. (2008) quantified several qualities of movement cell activity. Only activity onset was found to account for significant variability in reaction time. This was viewed as discrete flow of information to the movement preparation stage. Trials + VT θ - -θ VD t + tballistic = RT Change in growth rate: Hard Condition Reaction Time (ms) Representative FEF Cells Change in onset: Visual Cell Movement Cell Accumulated difference model: Thick:Target in RF Thin: Distractor in RF Black: Easy Search Gray: Hard Search Vertical: mean RT Easy: 199ms Hard: 229ms Thick:Target in RF Thin: Distractor in RF Black: Easy Search Gray: Hard Search Vertical: mean RT Easy: 191ms Hard: 258ms This work supported byAFOSR FA9550-07-1-0192, NSF SBE-0542013, NEI R01-EY08890, P30-EY08126, VU ACCRE and Ingram Chair of Neuroscience. We applied the same analyses to our simulated data to determine if the same patterns were observed in our continuous flow model. Activity (sp/s) Averaged Model Trajectories: Monkey M References: Schall JD. (2002) The neural selection and control of saccades by the frontal eye field. Phil Trans R Soc Lond B 357, 1073-1082. Hanes DP, Schall JD (1996) Neural control of voluntary movement initiation. Science 274(5286), 427-430. Boucher L, Palmeri TJ, Logan GD, Schall JD (2007) Inhibitory control in mind and brain: an interactive race model of countermanding saccades. Psych Rev 114(2), 376-397. Woodman GF, Kang MS, Thompson K, Schall JD (2008) The effect of visual search efficiency on response preparation: neurophysiological evidence for discrete flow. Psych Sci 19(2), 128. Easy Condition Hard Condition Response time (RT) is given when activity, a(t), exceeds a constant threshold, θ or – θ for a saccade to the target or to a distractor respectively, plus some ballistic movement time (tballistic). Time (ms) from Target Onset Absolute Difference Model Questions: These observations raise two questions: (1) Can visual cell activity account for variability in response times, and if so, (2) can this visual cell activity account for the variability in movement cell activity? Slow Med Fast Threshold Activity Note that θ and tballistic are the same for both the easy and hard search conditions. Accumulated Difference Model Time (ms) from Target Onset