IT- 601: Computer Graphics Lecture-03 Scan Conversion
Jesmin Akhter Lecturer,IIT Jahangirnagar University, Savar , Dhaka,Bangladesh. IT- 601: Computer Graphics Lecture-03 Scan Conversion. E. SE. Region 1. Region 2. SE. S. (-x 1 ,y 1 ). (x 1 ,y 1 ). (-x 2 ,y 2 ). (x 2 ,y 2 ). (-x 2 ,-y 2 ). (x 2 ,-y 2 ). (-x 1 ,-y 1 ). (x 1 ,-y 1 ).

IT- 601: Computer Graphics Lecture-03 Scan Conversion
E N D
Presentation Transcript
JesminAkhter Lecturer,IIT Jahangirnagar University, Savar, Dhaka,Bangladesh IT- 601: Computer GraphicsLecture-03Scan Conversion
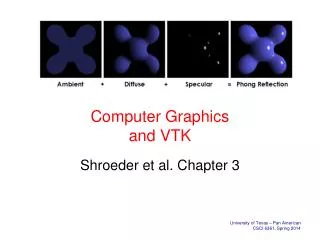
E SE Region 1 Region 2 SE S (-x1,y1) (x1,y1) (-x2,y2) (x2,y2) (-x2,-y2) (x2,-y2) (-x1,-y1) (x1,-y1) Midpoint Ellipse Algorithm • Implicit equation is: F(x,y) = b2x2 + a2y2 – a2b2 = 0 • We have only 4-way symmetry • There exists two regions • In Region 1 dx > dy • Increase x at each step • y may decrease • In Region 2 dx < dy • Decrease y at each step • x may increase
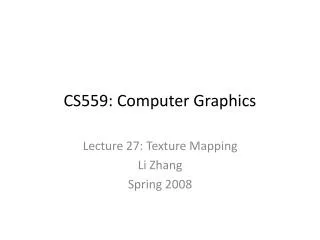
E M SE Next Current Previous Midpoint Ellipse Algorithm Decision Parameter (Region 1) Midpoint of the vertical line connecting E and SE is used to define the following decision parameter: Initial value with (0,b)
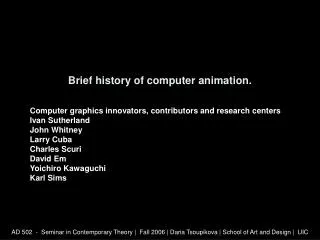
Previous Current Next SE S M Midpoint Ellipse Algorithm Decision Parameter (Region 2)
Self Study • Pseudo code for midpoint ellipse algorithm • Solved Problems: 3.1,3.2,3.6,3.7,3.10,3.11,3.12,3.20,3.21
Side Effects of Scan Conversion In computer graphics, a raster graphics image, or bitmap, is a dot matrix data structure representing a rectangular grid of pixels, or points of color, viewable via a monitor, paper, or other display medium The most common side effects when working with raster devices are: • Aliasing • Unequal intensity • Overstrike
1. Aliasing Jagged appearance of curves or diagonal lines on a display screen, which is caused by low screen resolution. Refers to the plotting of a point in a location other than its true location in order to fit the point into the raster. Consider equation y = mx + b For m = 0.5, b = 1 and x = 3 : y = 2.5 So the point (3,2.5) is plotted at alias location (3,3) Remedy Apply anti-aliasing algorithms. Most of these algorithms introduce extra pixels and pixels are intensified proportional to the area of that pixel covered by the object.
1.44 1 2. Unequal Intensity Human perception of light is dependent on • Density and • Intensity of light source. Thus, on a raster display with perfect squareness, a diagonal line of pixels will appear dimmer that a horizontal or vertical line. Remedy • By increasing the number of pixels on diagonal lines.
3. Overstrike The same pixel is written more than once. This results in intensified pixels in case of photographic media. Remedy Check each pixel to see whether it has already been written to prior to writing a new point.
Example rx= 8 , ry = 6 2ry2x = 0(with increment 2ry2= 72) 2rx2y = 2rx2ry(with increment -2rx2= -128) Region 1 (x0, y0) = (0, 6) Move out of region 1 since 2ry2x > 2rx2y
Example Region 2 (x0, y0) = (7, 3)(Last position inregion 1) Stop at y = 0
Exercises • Draw the ellipse with rx = 6, ry = 8. • Draw the ellipse with rx = 10, ry = 14. • Draw the ellipse with rx = 14, ry = 10 and center at (15, 10).