Download

1 / 8
80 likes | 169 Views
Explore climate change effects with EP2 seasonal norms from 2008 onwards, focusing on temperature and CWV changes. Analyze increments for accurate forecasting and understand wind impact variations. Compare EP2 output with xoserve calculations for valid insights.

E N D
Demand Estimation Seasonal Normal Friday 2nd October 2009
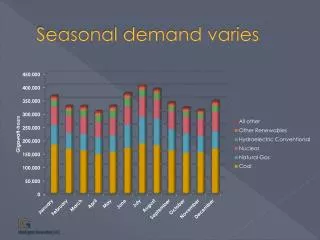
Increments from EP2 climate change • Changes in climate from the EP2 work provided: • A set of forecast years • Used to produce 31 year averages centred on each year from 2008 onwards • Output was converted to a single base year and increments • 2010 has a set of increments that specifically relate to the adjustment to raise the base year to a 31 year average centred on 2010 • Each year has a specific set of increments that vary • Cannot use one years increments with different base years as the two items need to sum to the EP2 forecast output
Increment changes • The following chart is from the Met Office EP2 output: • Lines show the increment needed to move the base year to each year in question • Increased in increment is not linear • Therefore to apply to different base years as in the xoserve method requires different increments • Significant cooling from inappropriate values • Solid lines are for max • Dotted lines for min 17 November 2014, E.ON, Page 3
Wind Impact • The following chart uses our calculation of CWV degree days: • CWV calculated as normal • CWV calculated with zero windspeed to show maximum warming • Comparison to average CWV calculated by xoserve using daily and average methods 17 November 2014, E.ON, Page 4
Wind Impact Chart 17 November 2014, E.ON, Page 5
Wind Impact • Wind seems to have less impact than xoserve are stating – second order • 7 days impact in June, 2 in July, 1 in August 2008 • Average summer impact 0.04 degree days per day • Total difference: • 0.2 degree days per day in 2008 • 0.18 degree days in 2007 • 0.17 degree days in 2006 • On average 40% lower with NO WIND than the daily to average calculation impact stated by xoserve suggesting incorrect increments have as large an impact to understating wind in averages • Average calculation fits at shoulder months to observed (true for 2005 to date) • Suggests that the EP2 limitations are not significant particularly with seasonal shape changes warming shoulder months and maximum temps 17 November 2014, E.ON, Page 6
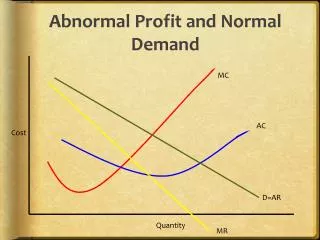
Impact of EP2 climate change • Changes in temperature from the EP2 climate work: • Increased warming over the period we are applying seasonal normal to • Warming greatest in shoulder months but also significant for other periods • EP2 designed to provide view of EXPECTED (normal) climate for each year 17 November 2014, E.ON, Page 7
Changes in CWV – to mitigate concern on wind effect • Changes in CWV between average method and daily method: • Average change for WM example used 0.09 (xoserve figures) • Maximum change 0.6 in June (xoserve figures) • Roughly equivalent to an effective temperature change of 0.12 (max 0.9) • EP2 change between 2010 and 2014 is an average of 0.14 (max 0.2 - June) • EP2 change between 2010 and 2012 is an average of 0.08 (max 0.11 - May) • Suggested option use 2010 as base year to compensate for the lack of cooling impact from averaging methodology?