Download
1 / 35
350 likes | 482 Views
Genesis of Tropical Storm Eugene (2005) from merging MCVs associated with ITCZ breakdowns. Chanh Q. Kieu and Da-Lin Zhang Department of Atmospheric and Oceanic Science University of Maryland. Outline. Introduction Overview of TS Eugene (2005) Model description and simulation

E N D
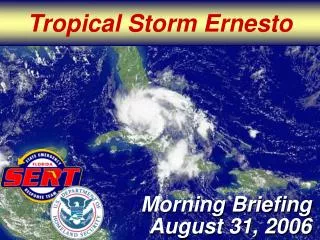
Genesis of Tropical Storm Eugene (2005) from merging MCVs associated with ITCZ breakdowns Chanh Q. Kieu and Da-Lin Zhang Department of Atmospheric and Oceanic Science University of Maryland NCU - 27 May 2008
Outline • Introduction • Overview of TS Eugene (2005) • Model description and simulation • Effects of vortex merger on TC genesis • PV and vorticity dynamics of vortex merger • Summary and conclusions
What is tropical cyclogenesis? From Raymond Zehr (1992)
Climatological conditions for TC genesis: • An underlying warm SST of at least 26.50C; • A finite-amplitude low-level cyclonic disturbance; • Weak vertical wind shear; • A tropical upper tropospheric trough (TUTT); • A moist lower to middle troposphere; and • A location poleward of 50 latitude.
TC genesis may occur from • Large-scale controls: e.g., MJO, easterly wave, monsoon trough, cold surge • Mesoscale convective systems or MCVs • Topography • ITCZ breakdown • Vortex merger
TC genesis associated with the ITCZ breakdowns Charney (1962), Nieto Ferreira and Schubert (1997) show that such breakdowns can be due to internal dynamic instability
The ITCZ Breakdowns at 0000 UTC 11 July 2005 V1 850-hPa streamlines and isotachs V1
E V1 V2 Hovmöller diagram of the 850-hPa vertical relative vorticity (unit: 10-5 s-1) Hovmöller diagram of the 850-hPa vertical relative vorticity from NCEP’s reanalysis Hurricane Emily
V2 V1 GOES-10/12 VIS 0000 UTC 17 Jul 2005 Satellite overview of Eugene (from TCSP-CIMSS) Emily
V2 V1 GOES-10/12 VIS 0600 UTC 17 Jul 2005 Satellite overview of Eugene (from TCSP-CIMSS) Emily
Satellite overview of Eugene (from TCSP-CIMSS) Emily V2 V1 GOES-10/12 VIS 1200 UTC 17 Jul 2005
V2 V1 GOES-10/12 VIS 1800 UTC 17 Jul 2005 Satellite overview of Eugene (from TCSP-CIMSS) Emily
V2 V1 GOES-10/12 VIS 0000 UTC 18 Jul 2005 Satellite overview of Eugene (from TCSP-CIMSS) Emily
E GOES-10/12 VIS 0600 UTC 18 Jul 2005 Satellite overview of Eugene (from TCSP-CIMSS) Emily
E GOES-10/12 VIS 1200 UTC 18 Jul 2005 Satellite overview of Eugene (from TCSP-CIMSS) Emily
Model Description • Nested-grid resolutions: 36/12/4/1.33 km; 38 levels • Lin et al. (1983) 3-ice cloud microphysics scheme for 4-km and 1.33-km resolution domains; • Kain-Fritsch (1990) cumulus parameterization scheme for the 36-km and 12-km resolution domains; • The Yonsei University PBL parameterization; • The Rapid Radiative Transfer Model (RRTM) scheme for both longwave and shortwave radiations; • Integration: 0000 Z 17 - 0000 Z 21 July 2005 (4 days)
Nested domains & surface circulations Emily NCU - 27 May 2008
The merging period CTL OBS OBS CTL OBS CTL 38 m s-1 31 m s-1 (a) 989 hPa 987 hPa (b) Simulated track and intensity vs. the best track VMAX PSEA Vertical shear NCU - 27 May 2008
E V2 V1 Hovmöller diagram of the 850-hPa vertical relative vorticity (0000 UTC 17 - 0000 UTC 21 July 2005)
T = 0600UTC18JUL T = 1200UTC18JUL B V1 B V1 V2 V2 A A
T = 1800UTC18JUL T = 0600UTC19JUL B B E E A A
NOV1 CTL NOV1 CTL CTL NOV1 Roles of the vortex merger PSEA VMAX In this experiment, the MCV V1 is removed at the initial time. All other configurations are the same NCU - 27 May 2008
Z MCS 1 MCS 2 X Conceptual model: TC genesis from the top downward Large-scale cyclone Z Merged MCS 3 Large-scale cyclone X Dry processes, related to more than 1 vortex, involve the downward growth of cyclonic vorticity (Ritchie and Holland 1997) Moist processes, related to one midlevel vortex extending downward, need air-sea interaction (Bister and Emanuel 1997)
Conceptual model: TC genesis from the bottom upward Cyclonic vorticity intensifies from the bottom upward due to the upscale growth of VHTs through merging by Hendricks et al. (2004) Cyclonic vorticity intensifies from the bottom upward due to the low-level convergence through stretching by Zhang and Bao (1996)
V1 V1 V1 V2 V2 V1 V1 E V2 V2 V1 V1 E V2 V2 Horizontal distribution of the vertically averaged PV between z =1.5 km to z =12 km within the control volume (shaded, intervals of 1 PVU). Superimposed is the flow field at z = 3 km
E V1 V1 V1 V1 V1 E E V2 V2 V2 V2 V2 V2 West-east cross sections of the N-S (720 km) averaged PV for the control volume (shaded, at intervals of 1 PVU), along the centers of V1 and V2. Superimposed is PV tendency (intervals of 2 10-5 PVU s-1)
Prognostic equation of PV, following a parcel, is written as Applying this parcel concept or MPV to TCs could not help understand why PV increases in the deep troposphere. So, it is more appropriate to write the above equation in an integral form for a control volume QTEN = QCON QH QFRC QBND In this study, the volume is chosen as [0,720 km] [0, 720 km] [1, 12 km] and it moves with the storm center. The forcing terms, from left to right, on the rhs of the integral equation are respectively called QCON, QH, QFRC, and QBND
Volume-integrated PV Volume-integrated PV - QBND VSFC PSEA
PV (solid) & QCON (shadings) t(solid) & H (shadings)
Flux form of the absolute vorticity equation: (solid) & V(shadings) t (solid) & Volume tilting (shadings) hV(contours) & Volume stretching (shadings)
700 500 200 700 900 900 500 200 500 900 700 200 200 700 900 500 700 500 700 900 200 900 500 200 Radar reflectivity and vertical shear E v1 v2 E E E E
A (a) B (b) (c) Vertical wind shear and moist downdrafts/dry intrusion (a) e (every 2 K), and w (shaded at intervals 0.1 m s-1 for descending and 0.3 m s-1 for ascending) at 700 hPa at 19/12-60; (b) as in (a) but for vertical cross section through the storm center of e (at intervals of 2 K) and deviation potential temperature (’, shaded); and (c) as in (b) but for 19/18-66.
Summary and Conclusions • The WRF model reproduces well the track, intensity, and vortex-merger during the life cycle of Eugene; • The vortex merger is critical for the genesis of Eugene; • The storm-scale PV increases due to the PV fluxes from the ITCZ, and condensing of PV substance associated with diabatic heating; • Vortex merger is characterized with sharp increases in diabatic heating, PV, 3D divergence, 2D convergence and cyclonic vorticity; • Cyclonic vorticity tends to grow from bottom up due to the storm-scale stretching; • Vertical shear tends to produce wavenumber-1 rainfall during TC genesis, and induce downdrafts upshear in the minimum e layer; • The melting cooling appears to account for the peak PV above the melting layer, and midlevel convergence.
Vertical profiles of the area-averaged (a), (b), and (c) the absolute vorticity (solid, unit: 10-5 s-1), PV (dotted, unit: 0.2 PVU), the 3D velocity divergence (dashed, unit: 10-5 s-1), and diabatic heating rates (dot-dashed, unit: 10-5 K s-1 ); and (c), (d) and (f) PV generation rates by diabatic heating (solid, unit: 10-5 PVU s-1), PV condensing rates (dashed, unit: 10-5 PVU s-1), the lateral boundary PV fluxes (dot-dashed; unit: 10-5 PVU s-1 ), -(wQ)/z (thin-dashed; unit: 10-5 PVU s-1) and the total PV rates (dotted) for the control volume from the two different times: 18/03-27 (left panel), and 18/12-36 (middle panel) and 20/18-90 (right panel)
PV (solid) & QCON (shadings) 3D V(solid) & QH (shadings) QBND-lateral (contours) & qt(shadings) t(solid) & H (shadings)