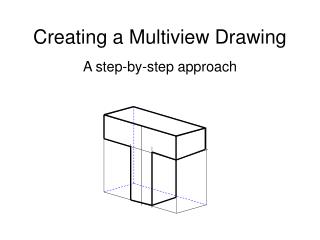
Drawing a Profile
In this activity, we explore the topography of Lost Creek by drawing a profile based on the provided map. First, determine the contour interval of the map, which is 50 feet. Next, identify the flow direction of Lost Creek using the "V" shapes on the map, indicating it flows south or southeast. Using a piece of paper, mark every intersection of contour lines with a dash, then hold it up to create a visual profile above the elevation points. Finally, calculate the average gradient along the line from point C to point D, yielding a gradient of 25 ft/mi over a distance of 6 miles.


Drawing a Profile
E N D
Presentation Transcript
Drawing a Profile Final Review
2. Toward which compass directions does Lost Creek flow? HINT- Look at the V’s!!! South or SE LOST CREEK
Draw a Profile of Line A-B • Place a piece of • paper UNDER line A-B • Put a dash on your • paper every time a • contour line crosses your • piece of paper 3. Hold up your paper to the graph that is provided • Put a point above each • elevation
4. What is the average gradient, in feet per mile, along the straight line from point C to point D? Gradient = Change in Field Value Distance =200-50 feet 6 mi =25 ft/mi