Download
1 / 29
290 likes | 310 Views
This talk outlines the modeling of "min-bias" collisions and studying pile-up at the LHC. It discusses the CDF "Min-Bias" trigger and the effects of stable particles and particle densities.

E N D
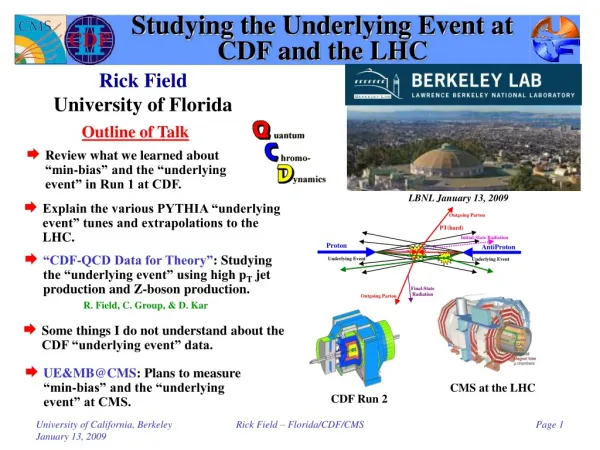
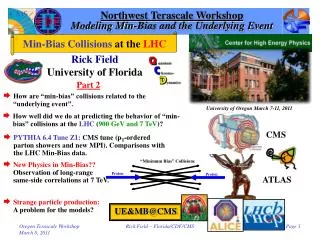
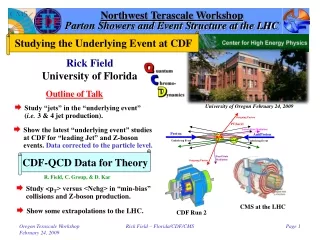
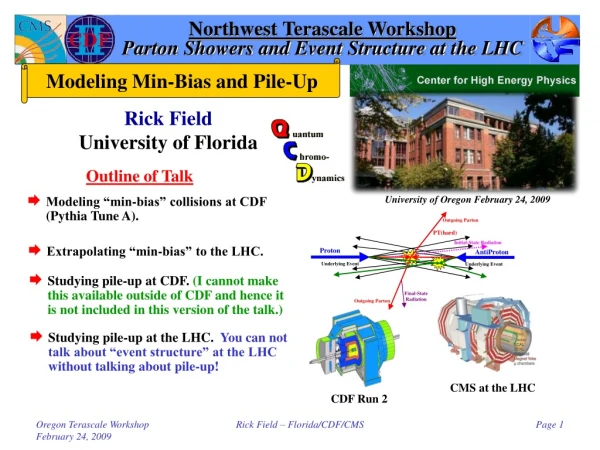
Northwest Terascale WorkshopParton Showers and Event Structure at the LHC Modeling Min-Bias and Pile-Up Rick Field University of Florida Outline of Talk University of Oregon February 24, 2009 • Modeling “min-bias” collisions at CDF (Pythia Tune A). • Extrapolating “min-bias” to the LHC. • Studying pile-up at CDF. (I cannot make this available outside of CDF and hence it is not included in this version of the talk.) • Studying pile-up at the LHC. You can not talk about “event structure” at the LHC without talking about pile-up! CMS at the LHC CDF Run 2 Rick Field – Florida/CDF/CMS
Proton-AntiProton Collisionsat the Tevatron The CDF “Min-Bias” trigger picks up most of the “hard core” cross-section plus a small amount of single & double diffraction. stot = sEL + sIN stot = sEL + sSD+sDD+sND 1.8 TeV: 78mb = 18mb + 9mb + (4-7)mb + (47-44)mb CDF “Min-Bias” trigger 1 charged particle in forward BBC AND 1 charged particle in backward BBC The “inelastic non-diffractive” component contains both “hard” and “soft” collisions. Beam-Beam Counters 3.2 < |h| < 5.9 Rick Field – Florida/CDF/CMS
No-Bias vs Min-Bias What you see for “Min-Bias” depends on your triggger! By comparing different “Min-Bias” triggers one can learn about the components! About 2.5 charged particles per unit h at h = 0. About 0.9 charged particles (pT > 0.5 GeV/c) per unit h at h = 0. • Charged particle (all pT) pseudo-rapidity distribution, dNchg/dhdf, at 1.96 TeV with no trigger (i.e. no-bias) from PYTHIA Tune DW. • Charged particle (pT > 0.5 GeV/c) pseudo-rapidity distribution, dNchg/dhdf, at 1.96 TeV with the CDF Min-Bias trigger from PYTHIA Tune DW. About 1.5 charged particles (pT > 0.5 GeV/c) per unit h at h = 0 with CDF min-bias trigger. Rick Field – Florida/CDF/CMS
Proton AntiProton Min-Bias Particle Types This is a bigger effect than I expected! With Stable Particles • Using ct = 10 mm reduces the charged particle density by almost 10%! Mostly from Ks→p+p- (68.6%) and L →pp- (64.2%). With ct = 10mm No-Bias at 14 TeV charged particle density: 10mm vs Stable Stable if ct≥ 10 mm! CDF Run 2 60 cm Rick Field – Florida/CDF/CMS
3 charged particles dNchg/dhdf = 3/4p = 0.24 1 charged particle Divide by 4p 1 GeV/c PTsum dNchg/dhdf = 1/4p = 0.08 3 GeV/c PTsum dPTsum/dhdf = 1/4p GeV/c = 0.08 GeV/c dPTsum/dhdf = 3/4p GeV/c = 0.24 GeV/c Particle Densities • Study the charged particles (pT > 0.5 GeV/c, |h| < 1) and form the charged particle density, dNchg/dhdf, and the charged scalar pT sum density, dPTsum/dhdf. Charged Particles pT > 0.5 GeV/c |h| < 1 CDF Run 2 “Min-Bias” DhDf = 4p = 12.6 Rick Field – Florida/CDF/CMS
CDF Run 1 “Min-Bias” DataCharged Particle Density • Shows CDF “Min-Bias” data on the number of charged particles per unit pseudo-rapidity at 630 and 1,800 GeV. There are about 4.2 charged particles per unit h in “Min-Bias” collisions at 1.8 TeV (|h| < 1, all pT). <dNchg/dh> = 4.2 <dNchg/dhdf> = 0.67 • Convert to charged particle density, dNchg/dhdf, by dividing by 2p. There are about 0.67 charged particles per unit h-f in “Min-Bias” collisions at 1.8 TeV (|h| < 1, all pT). 0.25 0.67 • There are about 0.25 charged particles per unit h-f in “Min-Bias” collisions at 1.96 TeV (|h| < 1, pT > 0.5 GeV/c). Rick Field – Florida/CDF/CMS
24% increase <dNchg/dhdf> = 0.63 h = 0 1.8 TeV <dNchg/dhdf> = 0.51 h = 0 630 GeV CDF Run 1 “Min-Bias” DataEnergy Dependence LHC? • Shows the center-of-mass energy dependence of the charged particle density, dNchg/dhdf, for “Min-Bias” collisions at h = 0. Also show a log fit (Fit 1) and a (log)2 fit (Fit 2) to the CDF plus UA5 data. • What should we expect for the LHC? Rick Field – Florida/CDF/CMS
Herwig “Soft” Min-Bias Can we believe HERWIG “soft” Min-Bias? Can we believe HERWIG “soft” Min-Bias? No! LHC? • Shows the center-of-mass energy dependence of the charged particle density, dNchg/dhdf, for “Min-Bias” collisions compared with the HERWIG “Soft” Min-Bias Monte-Carlo model. Note: there is no “hard” scattering in HERWIG “Soft” Min-Bias. • HERWIG “Soft” Min-Bias contains no hard parton-parton interactions and describes fairly well the charged particle density, dNchg/dhdf, in “Min-Bias” collisions. • HERWIG “Soft” Min-Bias predicts a 45% rise in dNchg/dhdf at h = 0 in going from the Tevatron (1.8 TeV) to the LHC (14 TeV). 4 charged particles per unit h becomes 6. Rick Field – Florida/CDF/CMS
CDF Run 1 “Min-Bias” DatapT Distribution Lots of “hard” scattering in “Min-Bias”! HERWIG “Soft” Min-Bias • Shows the energy dependence of the charged particle density, dNchg/dhdf, for “Min-Bias” collisions compared with HERWIG “Soft” Min-Bias. • Shows the pT dependence of the charged particle density, dNchg/dhdfdPT, for “Min-Bias” collisions at 1.8 TeV collisions compared with HERWIG “Soft” Min-Bias. • HERWIG “Soft” Min-Bias does not describe the “Min-Bias” data! The “Min-Bias” data contains a lot of “hard” parton-parton collisions which results in many more particles at large PT than are produces by any “soft” model. Rick Field – Florida/CDF/CMS
No easy way to “mix” HERWIG “hard” with HERWIG “soft”. CDF Run 1 “Min-Bias” DataCombining “Soft” + “Hard” HERWIG diverges! sHC PYTHIA cuts off the divergence. Can run PT(hard)>0! • HERWIG “hard” QCD with PT(hard) > 3 GeV/c describes well the high pT tail but produces too many charged particles overall. Not all of the “Min-Bias” collisions have a hard scattering with PT(hard) > 3 GeV/c! HERWIG “soft” Min-Bias does not fit the “Min-Bias” data! • One cannot run the HERWIG “hard” QCD Monte-Carlo with PT(hard) < 3 GeV/c because the perturbative 2-to-2 cross-sections diverge like 1/PT(hard)4? Rick Field – Florida/CDF/CMS
PYTHIA Tune A Min-Bias“Soft” + ”Hard” Tuned to fit the CDF Run 1 “underlying event”! PYTHIA Tune A CDF Run 2 Default 12% of “Min-Bias” events have PT(hard) > 5 GeV/c! 1% of “Min-Bias” events have PT(hard) > 10 GeV/c! • PYTHIA regulates the perturbative 2-to-2 parton-parton cross sections with cut-off parameters which allows one to run with PT(hard) > 0. One can simulate both “hard” and “soft” collisions in one program. Lots of “hard” scattering in “Min-Bias” at the Tevatron! • The relative amount of “hard” versus “soft” depends on the cut-off and can be tuned. • This PYTHIA fit predicts that 12% of all “Min-Bias” events are a result of a hard 2-to-2 parton-parton scattering with PT(hard) > 5 GeV/c (1% with PT(hard) > 10 GeV/c)! Rick Field – Florida/CDF/CMS
CDF Run 2 Min-Bias “Associated”Charged Particle Density “Associated” densities do not include PTmax! Highest pT charged particle! • Use the maximum pT charged particle in the event, PTmax, to define a direction and look at the the “associated” density, dNchg/dhdf, in “min-bias” collisions (pT > 0.5 GeV/c, |h| < 1). It is more probable to find a particle accompanying PTmax than it is to find a particle in the central region! • Shows the data on the Df dependence of the “associated” charged particle density, dNchg/dhdf, for charged particles (pT > 0.5 GeV/c, |h| < 1, not including PTmax) relative to PTmax (rotated to 180o) for “min-bias” events. Also shown is the average charged particle density, dNchg/dhdf, for “min-bias” events. Rick Field – Florida/CDF/CMS
CDF Run 2 Min-Bias “Associated”Charged Particle Density Rapid rise in the particle density in the “transverse” region as PTmax increases! PTmax > 2.0 GeV/c Transverse Region Transverse Region Ave Min-Bias 0.25 per unit h-f PTmax > 0.5 GeV/c • Shows the data on the Df dependence of the “associated” charged particle density, dNchg/dhdf, for charged particles (pT > 0.5 GeV/c, |h| < 1, not including PTmax) relative to PTmax (rotated to 180o) for “min-bias” eventswith PTmax > 0.5, 1.0, and 2.0 GeV/c. • Shows “jet structure” in “min-bias” collisions (i.e.the “birth” of the leading two jets!). Rick Field – Florida/CDF/CMS
CDF Run 2 Min-Bias “Associated”Charged Particle Density PY Tune A PTmax > 2.0 GeV/c Transverse Region Transverse Region PTmax > 0.5 GeV/c • Shows the data on the Df dependence of the “associated” charged particle density, dNchg/dhdf, for charged particles (pT > 0.5 GeV/c, |h| < 1, not including PTmax) relative to PTmax (rotated to 180o) for “min-bias” eventswith PTmax > 0.5 GeV/c and PTmax > 2.0 GeV/c compared with PYTHIA Tune A (after CDFSIM). • PYTHIA Tune A predicts a larger correlation than is seen in the “min-bias” data (i.e.Tune A “min-bias” is a bit too “jetty”). Rick Field – Florida/CDF/CMS
PYTHIA Tune ALHC Min-Bias Predictions LHC? • Shows the center-of-mass energy dependence of the charged particle density, dNchg/dhdf, for “Min-Bias” collisions compared with PYTHIA Tune A with PT(hard) > 0. • PYTHIA was tuned to fit the “underlying event” in hard-scattering processes at 1.8 TeV and 630 GeV. • PYTHIA Tune A predicts a 42% rise in dNchg/dhdf at h = 0 in going from the Tevatron (1.8 TeV) to the LHC (14 TeV). Similar to HERWIG “soft” min-bias, 4 charged particles per unit h becomes 6. Rick Field – Florida/CDF/CMS
PYTHIA Tune ALHC Min-Bias Predictions 12% of “Min-Bias” events have PT(hard) > 10 GeV/c! LHC? • Shows the center-of-mass energy dependence of the charged particle density, dNchg/dhdfdPT, for “Min-Bias” collisions compared with PYTHIA Tune A with PT(hard) > 0. 1% of “Min-Bias” events have PT(hard) > 10 GeV/c! • PYTHIA Tune A predicts that 1% of all “Min-Bias” events at 1.8 TeV are a result of a hard 2-to-2 parton-parton scattering with PT(hard) > 10 GeV/c which increases to 12% at 14 TeV! Rick Field – Florida/CDF/CMS
Charged <PT> versus Nchg • Shows the average transverse momentum of charged particles (|h|<1, pT>0.5 GeV) versus the number of charged particles, Nchg, for the CDF Run 2 Min-Bias events. The charged <PT> rises with Nchg! Rick Field – Florida/CDF/CMS
Min-Bias Correlations New • Data at 1.96 TeV on the average pT of charged particles versus the number of charged particles (pT > 0.4 GeV/c, |h| < 1) for “min-bias” collisions at CDF Run 2. The data are corrected to the particle level and are compared with PYTHIA Tune A at the particle level (i.e. generator level). Rick Field – Florida/CDF/CMS
Min-Bias: Average PT versus Nchg • Beam-beam remnants (i.e. soft hard core) produces low multiplicity and small <pT> with <pT> independent of the multiplicity. • Hard scattering (with no MPI) produces large multiplicity and large <pT>. • Hard scattering (with MPI) produces large multiplicity and medium <pT>. This observable is sensitive to the MPI tuning! = + + The CDF “min-bias” trigger picks up most of the “hard core” component! Rick Field – Florida/CDF/CMS
PYTHIA 6.2 TunesLHC Min-Bias Predictions • Shows the predictions of PYTHIA Tune A, Tune DW, Tune DWT, and the ATLAS tune for the charged particle density dN/dh and dN/dY at 14 TeV (all pT). • PYTHIA Tune A and Tune DW predict about 6 charged particles per unit h at h = 0, while the ATLAS tune predicts around 9. • PYTHIA Tune DWT is identical to Tune DW at 1.96 TeV, but extrapolates to the LHC using the ATLAS energy dependence. Rick Field – Florida/CDF/CMS
PYTHIA 6.2 TunesLHC Min-Bias Predictions • Shows the predictions of PYTHIA Tune A, Tune DW, Tune DWT, and the ATLAS tune for the charged particle pT distribution at 14 TeV (|h| < 1) and the average number of charged particles with pT > pTmin (|h| < 1). • The ATLAS tune has many more “soft” particles than does any of the CDF Tunes. The ATLAS tune has <pT> = 548 MeV/c while Tune A has <pT> = 641 MeV/c (100 MeV/c more per particle)! Rick Field – Florida/CDF/CMS
Proton AntiProton Studying Pile-Up at CDF High PT Jet • The primary vertex is the highest PTsum of charged particles pointing towards it. CDF Run 2 60 cm 396 ns MB • Normally one only includes those charged particles which point back to the primary vertex. • The primary vertex is presumably the collision that satisfied the trigger. Maybe not for “min-bias” events? • How well do we understand the pile-up at CDF? • Is the pile-up biased? • Is the pile-up the same for all triggers? • Does pile-up conspire to help satisfy your trigger? • How well do we model pile-up? Rick Field – Florida/CDF/CMS
Pile-Up at the LHC Tune DWT “Hard-Core” No Trigger (ct =10mm) • Shows the charged multiplicity distribution (|h| < 2, all pT) for Npile = 1 (i.e. shows, on the average, what one event looks like). The plot shows the probability of finding 0, 1, 2, … etc. charged particles. The sum of the points is equal to one. The mean is 24.39 charged particles and s = 19.7. • Shows the charged particle pseudo-rapidity distribution (all pT) for Npile = 1 (i.e. shows, on the average, what one event looks like). The plot shows the <Nchg> in a 0.4 bin (i.e. not divided by bin size). The sum of the points with |h| < 2 is 24.39. Rick Field – Florida/CDF/CMS
Pile-Up at the LHC “Central Limit Theorem”: <Nchg> ~ Npile, s ~ sqrt(Npile)! • Shows the charged multiplicity distribution (|h| < 2, all pT) for Npile = 10 (i.e. shows, on the average, what 10 events looks like). The plot shows the probability of finding 0, 10, 20, … etc. charged particles. The sum of the points is equal to one. The mean is 243.9 charged particles and s = 62.3. Also shown is the Npile = 1 distribution scaled by a factor of 10 (i.e. Nchg → 10×Nchg). Duh! True for any PT(min) cut! • Shows the charged multiplicity distribution (|h| < 2, all pT) for Npile = 50 (i.e. shows, on the average, what 50 events looks like). The plot shows the probability of finding 0, 50, 100, … etc. charged particles. The sum of the points is equal to one. The mean is 1219.5 charged particles and s = 138.9. Also shown is the Npile = 1 distribution scaled by a factor of 50 (i.e. Nchg → 50×Nchg) and the Npile = 10 distribution scaled by a factor of 5 (i.e. Nchg → 5×Nchg). Rick Field – Florida/CDF/CMS
Pile-Up at the LHC Log-Scale! • Charged multiplicity distribution (|h| < 2) for Npile = 1 (i.e. shows, on the average, what one event looks like). The plot shows the probability of finding 0, 1, 2, … etc. charged particles. The five curves correspond to pT(min) = 0, 1.0 , 2.5, 5.0, and 10.0 GeV/c. • Shows the charged particle pseudo-rapidity distribution for Npile = 1 (i.e. shows, on the average, what one event looks like). The plot shows the <Nchg> in a 0.4 bin (i.e. not divided by bin size). The five curves correspond to pT(min) = 0, 1.0 , 2.5, 5.0, and 10.0 GeV/c. Rick Field – Florida/CDF/CMS
Pile-Up at the LHC • Shows the charged particle pT distribution (|h| < 2) for Npile = 1 (i.e. shows, on the average, what one event looks like). The plot shows the <Nchg> in a 1.0 GeV/c bin (i.e. not divided by bin size). The sum of the points gives 24.39. Hard-Scattering Tail! • Shows the average number of charged particle the PT-cut (|h| < 2) for Npile = 1 (i.e. shows, on the average, what one event looks like). The first point corresponds to <Nchg> = 24.39. The fit corresponds to <Nchg>=24.39exp(-1.4pT(min)). Rick Field – Florida/CDF/CMS
Pile-Up at the LHC <AssocNchg>+1 ≈ <Nchg>! • Shows the charged multiplicity distribution (pT > 5 GeV/c, |h| < 2) for Npile = 1 (i.e. shows, on the average, what one event looks like). The plot shows the probability of finding 0, 1, 2, … etc. charged particles. The plot also shows the “associated multiplicity” distribution (open squares), <AssocNchg> = <Nchg> -1, for events with at least one charged particle with pT > 5 GeV/c (i.e. the over average multiplicity is <AssocNchg> +1 ) . Note that <AssocNchg> +1 = 1.277 and <Nchg> = 0.0466. There are many more particles in events with at least one charged particle with pT > 5 GeV/c, then in an average “min-bias” event. Also, note that the probability of getting an additional particle in an event with at least one charged particle with pT > 5 GeV/c (i.e. AssocNchg = 1 is greater than the probability of getting one particle in a typical “min-bias” event, Nchg = 1). <AssocNchg>+1 >> <Nchg>! Rick Field – Florida/CDF/CMS
Pile-Up at the LHC • Shows the probability of finding Nchg ≥ 1 and Nchg ≥ 2 (pT > 5 GeV/c, |h| < 2) versus Npile, where Npile = 1 means one event, Npile = 10 means 10 events, etc.. . The plot also shows the probability of finding AssocNchg ≥ 1 (overall multiplicity ≥ 2) for events with at least one charged particle with pT > 5 GeV/c. For Npile = 1 (i.e. one event) there is a strong correlation since Prob(AssocNchg≥ 1) is much greater than Prob(Nchg≥ 2). However, this correlation diminishes as Npile becomes large • Shows the “correlation” (Corr = 1 - Prob(AssocNchg≥ 1)/Prob(Nchg≥ 2)) versus Npile, where Npile = 1 means one event, Npile = 10 means 10 events, etc.. . This correlation is very large for one event (i.e. Npile = 1) and diminishes as Npile becomes large. “Central Limit Theorem”strikes again?? Rick Field – Florida/CDF/CMS
Min-Bias & Pile-Up Summary • “Min-Bias” is not well defined. What you see depends on what you trigger on! Every trigger produces some biases. We learn about “min-bias” by comparing different “low bias” triggers. • We are doing a fairly good job in modeling “min-bias” and pile-up at CDF (i.e. Pythia Tune A, Tune AW, Tune DW), but extrapolations to the LHC are still uncertain! • Studying pile-up at CDF is more difficult than I thought due to primary vertex splitting (and merging). I do not know to what extent pile-up is process (i.e. trigger) dependent and to what extent it helps satisfy the trigger requirements. This would have big implications for the LHC! Rick Field – Florida/CDF/CMS