Phytoplankton Diversity and Molecular Marker Studies in the Red Sea (1999-2000)
40 likes | 156 Views
This study analyzes phytoplankton diversity in the Red Sea over 15 time points between February 1999 and January 2000. DNA was extracted for PCR analysis from water samples collected at depths of 0-200 m, supplemented by cell concentrates. Ancillary data included cell counts, chlorophyll a fluorescence, and nutrient concentrations (TON, nitrate, nitrite, SRP, ammonium). Phytoplankton diversity was assessed using dot blots with specific probes for Synechococcus and Prochlorococcus, and TTGE analysis provided insights into species distribution and hybridization rates.

Phytoplankton Diversity and Molecular Marker Studies in the Red Sea (1999-2000)
E N D
Presentation Transcript
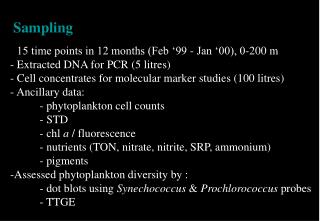
Sampling - 15 time points in 12 months (Feb ‘99 - Jan ‘00), 0-200 m - Extracted DNA for PCR (5 litres) - Cell concentrates for molecular marker studies (100 litres) - Ancillary data: - phytoplankton cell counts - STD - chl a / fluorescence - nutrients (TON, nitrate, nitrite, SRP, ammonium) - pigments -Assessed phytoplankton diversity by : - dot blots using Synechococcus & Prochlorococcus probes - TTGE
TTGE (1) Phaeocystis globosa DYF25 (prym) Isochrysis galbana Emiliana huxleyi DYF18 (crypto) Tricho. erythraeum Prochlorococcus Synechococcus 7.9 8.3 23.8 18.7 4.10 11.5 14.6 19.4 10.1 16.2 27.4 18.10 22.11 27.12
1 50 100 150 200 10 30 50 80 100 150 TTGE (2) Phaeocystis globosa DYF25 (prym) Isochrysis galbana Emiliana huxleyi DYF18 (crypto) Tricho. erythraeum Prochlorococcus Synechococcus 8.3.99 7.9.99
A 18.7.99 23.8.99 18.10.99 27.12.99 27.4.99 relative hybridisation (%) relative hybridisation (%) relative hybridisation (%) relative hybridisation (%) relative hybridisation (%) 0 20 40 60 80 100 0 20 40 60 80 100 0 20 40 60 80 100 0 20 40 60 80 100 0 0 20 40 60 80 100 0 0 0 0 25 25 25 25 25 50 50 50 50 50 75 75 75 75 75 Depth (m) 100 100 100 100 100 HLII 125 125 125 125 125 LL 150 150 150 150 150 175 175 175 175 175 200 200 200 200 200 HLII LL EUB HLII LL EUB HLII LL EUB HLII LL EUB HLII LL EUB B C 0 1.0E+05 2.0E+05 0 1.0E+05 2.0E+05 0 1.0E+05 2.0E+05 1.0E+05 0 2.0E+05 0 1.0E+05 2.0E+05 0 0 0 0 0 50 50 50 50 50 Depth (m) 100 100 100 100 100 Euk Syn Pro 150 150 150 150 150 200 200 200 200 200 Prochlorococcus dot blots : Red Sea 1999-2000


