Download
1 / 24
240 likes | 413 Views
Announcements: -- For lecture next week, read Chapters 8 (Now read 1-9) -- For lab this week, also read Chapter 13 No Colloquium this week (we have boring faculty meetings) January 30: Joseph Pfaller, Department of Biological Science, FSU “Scaling of morphology and

E N D
Announcements: -- For lecture next week, read Chapters 8 (Now read 1-9) -- For lab this week, also read Chapter 13 No Colloquium this week (we have boring faculty meetings) January 30: Joseph Pfaller, Department of Biological Science, FSU “Scaling of morphology and bite-force generation in the durophagous turtle Sternotherus minor: implications for ecological performance throughout Development” Loggerhead musk turtles
I. Purpose of this Course II. The Scientific Method What are Foragers? Decision Making by Foragers A. Types of decisions B. Balancing Costs and Benefits in Decisions C. Optimal Diet Model D. Spatial Distribution of Resources 1. The Ideal Free Distribution (IDF) 2. Marginal Value Theorem in Patches E. Lots of other models V. Dynamics of Forager-Resource Numbers A. Dynamics of predator and prey are “tied” B. Behaviors Associated with changes in numbers.
Marginal Value Theorem and Optimal Give-up time. Can also make predictions about patch productivity
Marginal Value Theorem and Optimal Give-up time. Can make predictions about search or travel times
Marginal Value Theorem and Optimal Give-up time. Cowie, R. J. 1977. Optimal foraging in great tits Parus major. Nature 268: 137-139. Cowie had birds search for mealworms in sawdust filled pots in an aviary
I. Purpose of this Course II. The Scientific Method What are Foragers? Decision Making by Foragers V. Dynamics of Forager-Resource Numbers Experimental Design and Analyses A simple “how to” primer on doing experiments. We will be very concerned about experimental design for your proposals.
VI. Experimental Design and Analyses A. Types of Tests of Hypotheses -- remember that Science progresses by rejecting among alternative hypotheses. Two general types of tests: 1. Observational studies - two or more groups differ naturally in some aspect. 2. Experimental studies - two or more groups have been manipulated by the experimenter to be different in some aspect. -- often a “treatment” and “control -- may just be 2 or more “treatments”
What is the difference between observational and experimental studies? In general, experimental tests provide more conclusive results than observational tests. Groups that differ naturally in one respect may also differ in other, possibly unknown, respects making it impossible to conclude that results observed are due to one particular difference. WE WANT YOU TO CONDUCT AN EXPERIMENTAL, NOT OBSERVATIONAL, TEST FOR THIS CLASS.
Example: Mean SAT scores in Alabama and Florida. Alabama has significantly higher scores
Example: Mean SAT scores in Alabama and Florida.
VI. Experimental Design and Analyses A. Types of Tests of Hypotheses B. Replication 1. Number of replicates -- increasing number of replicates gives more confidence in average value.
Height converter: ALWAYS use metric in this class
VI. Experimental Design and Analyses A. Types of Tests of Hypotheses B. Replication 1. Number of replicates -- increasing number of replicates gives more confidence in average value.
VI. Experimental Design and Analyses A. Types of Tests of Hypotheses B. Replication 1. Number of replicates 2. Distribution of replicates -- segregated -- random -- systematic -- randomized block
VI. Experimental Design and Analyses A. Types of Tests of Hypotheses B. Replication 1. Number of replicates 2. Distribution of replicates C. Types of Data collected Two broad categories: 1. Discrete = categorical data, e.g. colors of flowers, gender, -- hard to get average 2. Continuous = pts. along a continuum, for example: time, weight, temperature -- can get mean, falls on scale
VI. Experimental Design and Analyses A. Types of Tests of Hypotheses B. Replication C. Types of Data collected 1. Discrete 2. Continuous Example of different Universities. -- how many students do they have? -- to what conference do they belong? -- do they have a football team? -- how many Rhodes Scholars do the have? -- what is the average temperature in December?
VI. Experimental Design and Analyses A. Types of Tests of Hypotheses B. Replication C. Types of Data collected 1. Discrete 2. Continuous D. Sampling units: Variable = class or category of data Observation = individual measure of a single variable Population = group of a similar kind, arbitrarily defined Sample = set of observations from a population Important distinction: we use a sample from a population, but can only assume that the results apply to the entire population.
VI. Experimental Design and Analyses A. Types of Tests of Hypotheses B. Replication C. Types of Data collected D. Sampling units E. Summarizing data using numbers or graphs: Discrete data: numbers or percent per category bar graphs of frequencies or numbers most useful
VI. Experimental Design and Analyses A. Types of Tests of Hypotheses B. Replication C. Types of Data collected D. Sampling units E. Summarizing data using numbers or graphs: Discrete data: numbers or percent per category bar graphs of frequencies or numbers most useful
VI. Experimental Design and Analyses A. Types of Tests of Hypotheses B. Replication C. Types of Data collected D. Sampling units E. Summarizing data using numbers or graphs: Continuous data: means, variances, range frequency distribution or bar graphs with variance indicated.
VI. Experimental Design and Analyses A. Types of Tests of Hypotheses B. Replication C. Types of Data collected D. Sampling units E. Summarizing data using numbers or graphs: Continuous data: Mathematical descriptions of how “variable” a set of observations are include variance: s2 = Also could use: standard deviation, confidence intervals, standard error of the mean. We will use variance, which assumes a normal distribution.
Experimental Design and Analyses Class data: 1. # facebook checks per day 2. # facebook friends • 3. Have you been to the third floor (upstairs) of the Dirac Science library • 4. Who should Kate end up with: Jack, Sawyer or you have no idea what I am talking about. • How do you get to FSU most days? • Are you female or male?
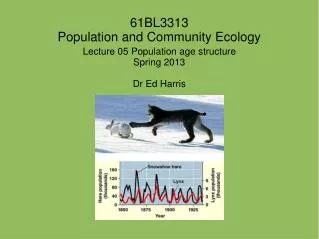
Past Student Projects: Squirrel reactions to humans during foraging in rural vs. urban environments Effect of patch quality and density on the foraging habits of the fire ant, Solanopsis invicta The effect of resource availability on ant lion pit formation The effect of color on the foraging behavior in fire ants Inter- and intraspecific competition influences on height as a function of plant densities in field mustard and raddish The effect of perceived predation risk on foraging behavior in red-winged blackbirds
Past Student Projects (cont.): The effect of Littorariairrorata density on Spartina stalk preference during tidal vertical migrations The relationship between cricket chirp rate and survival The effect of atmospheric oxygen levels on the growth rate of seedlings of a parasitic angiosperm The amount of preference domestic horses demonstrate for peat moss when compared to Bermuda grass and peanut hay Variation in food size and patch replenishment rate: A test of the Ideal Free Distribution Theory on gulls. The effect of environmental enrichment on the foraging behaviors of the common goldfish