Download
1 / 22
220 likes | 413 Views
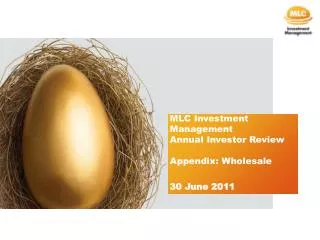
MLC Investment Management Annual Investor Review Appendix: Wholesale 30 June 2011. General advice warning and disclaimer. This information has been provided by MLC Limited (ABN 90 000 000 402) a member of the National Group, 105–153 Miller Street, North Sydney 2060.

E N D
MLC Investment ManagementAnnual Investor Review Appendix: Wholesale 30 June 2011
General advice warning and disclaimer This information has been provided by MLC Limited (ABN 90 000 000 402) a member of the National Group, 105–153 Miller Street, North Sydney 2060. Any opinions expressed in this communication constitute our judgement at the time of issue and are subject to change. We believe that the information contained in this communication is correct and that any estimates, opinions, conclusions or recommendations are reasonably held or made as at the time of compilation. However, no warranty is made as to their accuracy or reliability (which may change without notice) or other information contained in this communication. Past performance is not indicative of future performance. The value of an investment may rise or fall with the changes in the market. Please note that all performance reported is before management fees and taxes, unless otherwise stated. The specialist investment managers are current as at the date this communication was prepared. Investment managers are regularly reviewed and may be appointed or removed at any time without prior notice to you. This communication contains general information and may constitute general advice. Any advice in this communication has been prepared without taking account of individual objectives, financial situation or needs. It should not be relied upon as a substitute for financial or other specialist advice. Before making any decisions on the basis of this communication, you should consider the appropriateness of its content having regard to your particular investment objectives, financial situation or individual needs. You should obtain a Product Disclosure Statement or other disclosure document relating to any financial product issued by MLC Investments Limited (ABN 30 002 641 661 [include AFSL for PDSs/FSGs/Annual Reports]) and consider it before making any decision about whether to acquire or continue to hold the product. A copy of the Product Disclosure Statement or other disclosure document is available upon request by phoning the MLC call centre on 132 652 or on our website at mlc.com.au.
Historical Absolute Performance MLC Wholesale Horizon 3 Conservative Growth Portfolio (after taking into account fees) 15% 10% 5% Return % p.a. 0% -5% -10% 2002 2003 2004 2005 2006 2007 2008 2009 2010 2011 1 Year Ended 30 June 5 Years Ended 30 June MLC Horizon 3 Conservative Growth Portfolio – total returns Source: MLC Investment Management
Contribution to Total Return by Asset Class MLC Wholesale Horizon 3 Conservative Growth Portfolio (before taking into account fees) 4 4 3 3 2 2 Return Contribution % (annualised for periods greater than 1 year) 1 1 0 -1 -1 -2 Australian Shares Global Shares - Global Shares - Global Property LTAR Debt Securities Hedged Unhedged Securities 3 months to Jun-2011 1 year to Jun-2011 3 years to Jun-2011 5 years to Jun-2011 MLC Horizon 3 strategy– asset class contribution Source: MLC Investment Management
MLC Horizon 3 Conservative Growth Portfolio – peer relative performance Q3 Q3 Q2 Q3 Q4
Historical Absolute Performance MLC Wholesale Horizon 5 Growth Portfolio (after taking into account fees) 20% 15% 10% 5% Return % p.a. 0% -5% -10% -15% -20% 1999 2000 2001 2002 2003 2004 2005 2006 2007 2008 2009 2010 2011 1 Year Ended 30 June 5 Years Ended 30 June MLC Horizon 5 Growth Portfolio – total returns Source: MLC Investment Management
Contribution to Total Return by Asset Class MLC Wholesale Horizon 5 Growth Portfolio (before taking into account fees) 5 4 3 2 Return Contribution % (annualised for periods greater than 1 year) 1 0 -1 -2 Australian Shares Global Shares - Global Shares - Global Property LTAR Debt Securities Hedged Unhedged Securities 3 months to Jun-2011 1 year to Jun-2011 3 years to Jun-2011 5 years to Jun-2011 MLC Horizon 5 strategy– asset class contribution Source: MLC Investment Management
MLC Horizon 5 Growth Portfolio – peer relative performance Q3 Q3 Q2 Q3 Q4
Historical Absolute Performance MLC Wholesale Horizon 6 Share Portfolio (after taking into account fees) 30% 20% 10% Return % p.a. 0% -10% -20% -30% 2002 2003 2004 2005 2006 2007 2008 2009 2010 2011 1 Year Ended 30 June 5 Years Ended 30 June MLC Horizon 6 Share Portfolio – total returns Source: MLC Investment Management
Contribution to Total Return by Asset Class MLC Wholesale Horizon 6 Share Portfolio (before taking into account fees) 8 7 6 5 4 3 Return Contribution % (annualised for periods greater than 1 year) 2 1 0 -1 -2 -3 Australian Shares Global Shares - Hedged Global Shares - Unhedged LTAR 3 months to Jun-2011 1 year to Jun-2011 3 years to Jun-2011 5 years to Jun-2011 MLC Horizon 6 strategy– asset class contribution Source: MLC Investment Management
MLC Horizon 6 Share Portfolio – peer relative performance Q2 Q2 Q2 Q3 Q2
Historical Absolute Performance MLC Wholesale Australian Share Fund (after taking into account fees) 30% 25% 20% 15% 10% Return % p.a. 5% 0% -5% -10% -15% -20% 1999 2000 2001 2002 2003 2004 2005 2006 2007 2008 2009 2010 2011 1 Year Ended 30 June 5 Years Ended 30 June MLC Australian Share Fund – total returns Source: MLC Investment Management
Historical Absolute Performance MLC Wholesale Global Share Fund (after taking into account fees) 25% 20% 15% 10% 5% Return % p.a. 0% -5% -10% -15% -20% -25% 1999 2000 2001 2002 2003 2004 2005 2006 2007 2008 2009 2010 2011 1 Year Ended 30 June 5 Years Ended 30 June MLC Global Share Fund – total returns Source: MLC Investment Management
Historical Absolute Performance MLC Wholesale Global Property Fund (after taking into account fees) 40% 30% 20% 10% Return % p.a. 0% -10% -20% -30% -40% 2008 2009 2010 2011 1 Year Ended 30 June MLC Global Property Fund – total returns Source: MLC Investment Management
Historical Absolute Performance MLC Wholesale Property Securities Fund (after taking into account fees) 30% 20% 10% 0% Return % p.a. -10% -20% -30% -40% 1999 2000 2001 2002 2003 2004 2005 2006 2007 2008 2009 2010 2011 1 Year Ended 30 June 5 Years Ended 30 June MLC Property Securities Fund – total returns Source: MLC Investment Management
Historical Absolute Performance MLC Wholesale Diversified Debt Fund (after taking into account fees) 12% 10% 8% Return % p.a. 6% 4% 2% 0% 2009 2010 2011 1 Year Ended 30 June MLC Diversified Debt Fund – total returns Source: MLC Investment Management
Contribution to Total Return by Asset Class MLC Wholesale Diversified Debt Fund (before taking into account fees and tax) 3.0% 2.5% 2.0% 1.5% Return Contribution % (annualised for periods greater than 1 year) 1.0% 0.5% 0.0% -0.5% Australian Bonds Global Government Global Non- Global Multi-Sector Global High Yield Global Bank Loans Global Mortgages Bonds Government Bonds Bonds Bonds Quarter to Jun-11 1 Year to Jun-11 3 years to Jun-11 MLC Diversified Debt Fund – asset class contribution Source: MLC Investment Management
Manager Absolute Performance Wholesale Diversified Debt Fund (before taking into account fees) 20% 15% Manager Performance % 10% (annualised for periods greater than 1 year) 5% 0% Antares (all- UBS (all- Goldman Wellington Rogge (all- Amundi Franklin PIMCO W. R. Huff Oaktree Shenkman Stone Tower maturities) maturities) Sachs (all- Management maturities) Templeton Capital maturities) (all- maturities) Australian Australian Global Global Non- Global Non- Global Global Global Global Global Global Global Bonds Bonds Government Government Government Multi- Multi- Multi- High Yield High Yield Bank Mortgages Bonds Bonds Bonds Sector Sector Sector Bonds Bonds Loans Bonds Bonds Bonds Quarter to Jun-11 1 Year to Jun-11 3 years to Jun-11 MLC Diversified Debt Fund - manager contribution Source: MLC Investment Management
TM MLC IncomeBuilder Investment Trust (Wholesale) Distribution Analysis 18 16 14 3.97 12 3.78 3.96 2.27 10 Cents per unit 2.37 1.94 8 0.01 0.58 0.01 0.56 0.00 0.04 6 - 0.00 - 0.25 0.00 0.90 - 0.77 4 7.69 7.52 7.16 7.10 0.30 6.62 6.41 5.73 4.80 4.21 2 3.32 3.01 2.68 0.13 2.30 - 0.32 - 1998 1999 2000 2001 2002 2003 2004 2005 2006 2007 2008 2009 2010 2011 Financial Year End 30 June Underlying Income Taxable Capital Gains Buybacks Concessional (non-taxed) Capital Gains MLC IncomeBuilderTM Fund – distribution performance Source: MLC Investment Management
MLC IncomeBuilder™ Fund - The dividend environment is improving As at 30th June 2011 Source: MLC Investment Management
Manager Performance in Excess of the Index TM IncomeBuilder Strategy (before taking into account fees and tax) 3.0% 2.0% 1.0% 0.0% Excess Return vs S&P/ASX 200 All Industrials Index (annualised for periods greater than 1 year) -1.0% -2.0% -3.0% -4.0% Vanguard Maple-Brown Abbott IncomeBuilderTM Quarter to Jun-11 1 Year to Jun-11 3 years to Jun-11 5 Years to Jun-11 MLC IncomeBuilder ™ Fund – manager contribution Source: MLC Investment Management