Download
1 / 12
120 likes | 208 Views
Explore the notion of functions in mathematics, including the definition, vertical line test, representing functions through tables and graphs, and mathematical modeling with examples such as radioactive decay. Learn about algebraic and implicit forms, graph plotting, and Maple commands.

E N D
HUT – DEPARTMENT OF MATH. APPLIED-------------------------------------------------------------------------------------------------------- MATH 1 LEC 02: FUNCTION Instructor: Dr. Nguyen Quoc Lan (October, 2007)
NOTION OF FUNCTION ----------------------------------------------------------------------------------------------------------------------------------- Some quantity A changes and depends on another quantity B Function: A = f(B). Example: The human pouplation depends on the time
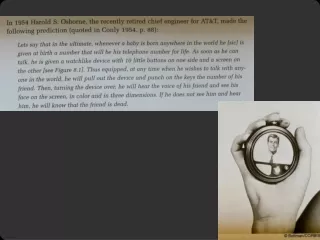
HISTORY ----------------------------------------------------------------------------------------------------------------------------------- 1786, Scotland: The Commercial an Political Atlas, Playfair. Graph used to compare exports, imports by England to Denmark … Mid – eighteenth century, Euler: By alphabet y = f(x)
MATHEMATICAL DEFINITION ----------------------------------------------------------------------------------------------------------------------------------- A function y = f(x): X R Y R: Rule associates each x X unique output (exactly one) y Y. Variablex, function (value) y. One x Two different y: It’s not a function Vertical test (for a graph) Domain D = {x| f(x) defined} Range Imf: y =f(x), xDf y = sinx D= R, Imf = [–1, 1]
THE VERTICAL LINE TEST ----------------------------------------------------------------------------------------------------------------------------------- The Vertical Line Test: a curve in the xy-plane is the graph of a function of x if and only if no vertical line intersects the curve more than once x=a x=a (a,c) (a,b) (a,b) a a This is the graph of a function of x This is not the graph of a function of x
GIVE A FUNCTION: TABLE OF ITS VALUE ----------------------------------------------------------------------------------------------------------------------------------- Verbally and table of it values: The natural way to represent the function C(w) expressing the cost of mailling first class letter is using a table of values
GIVE A FUNCTION: GRAPH ----------------------------------------------------------------------------------------------------------------------------------- Plot a picture (graph): For the function P(t) expressing the dependence of human population in time, one can express it by table of values, then construct a graph The graph of this function is a scatter plot
FUNCTION DEFINED BY ALGEBRAIC FORMULA ------------------------------------------------------------------------------------------------------------------------------------------- Explicit form: y = f(x) Example: y = x2, elementary functions : 1 t 1 (x, y) Formula: Example: x = 1 + t, y = 1 – t Line Example: x = acost, y = asint Circle Implicit form F(x, y) = 0 y = f(x) Example: x2 + y2 – 4 = 0,
MAPLE ----------------------------------------------------------------------------------------------------------------------------------- • (Declare a function) p := x^3 + x^2 + 1; • (Evalue its value) subs(x=1, p); • (Evalue its limit) limit( sin(2*x)/x, x = 0) ; • (Evalue its derivative) diff(p, x) ; (2nd order) diff(p,x$2) • (Graph) plot(sin(x), x = 0..Pi); (Many graphs) plot( [sin(x),cos(x)],x = 0..2*Pi, color = [red,blue]); • (Parametric curve) plot( [31*cos(t)-7*cos(31*t/7), 31*sin(t)-7*sin(31*t/7), t = 0..14*Pi] ); • plot( [17*cos(t)+7*cos(17*t/7), 17*sin(t)- …, t = 0..14*Pi] );
MATHEMATICAL MODEL: RADIOACTIVE DECAY -------------------------------------------------------------------------------------------------------------------------------- Radioactive elements disintegrate continuously in a process called radioactive decay. Experimentation has shown that the rate of disintegration is proportional to the amount of the element present. Find the rule of the radioactive decay process Solution: Suppose that m = m(t): the amount at time t The rate of disintegration is dm/dt. The assumption above gives:
MATHEMATICAL MODEL: RADIOACTIVE DECAY -------------------------------------------------------------------------------------------------------------------------------- By the expression of m(t), all radioactive elements have a common special property: after some constant period of time, its original amount will reduce by half the half – life. Every radioactive element has a specific half – life, and it depends only on decay rate, not on the initial amount The half – life of radioactive carbon C – 14 is about 5730 years. Find the expression m(t) of C – 14? Solution: T – the half – life The amount: m0/2 at time T:
THE SHROUD OF TURIN -------------------------------------------------------------------------------------------------------------------------------- In 1988 the Vatican authorized the British Museum to date a cloth relic called the Shroud of Turin, possibly the burial shroud of Jesus of Nazareth. This cloth founded in 1356 and contains the negative image of a human body. From the British Museum: the fibers in the cloth contained between 92% and 93% of their original carbon C – 14. Conclusion? Solution: From R/R0: 0.92 0.93 The test: 1988 The shroud was between 600 – 688 years old!