Desing Data base Systems
This guide covers the key aspects of database design, focusing on the structure and relationships within databases. Databases are vital for organizing data effectively, eliminating duplication, and promoting accuracy. We explore Entity-Relationship Diagrams (ERDs), a graphical representation of entities and their relationships. Key topics include attributes of entities, types of relationships, cardinality, and participation. Understanding these concepts is essential for effective data management and supports business functions by ensuring consistent and retrievable information.

Desing Data base Systems
E N D
Presentation Transcript
Hierarchy database • The structure of data is like a tree • Parent-children relationship • Pointers Central depot West depot East depot Győr Pécs Szeged Debrecen
Net database Dairy collection The data are connected to eachother like a ring, and these rings are the net model. (graph) Centre Area of Fót Area of Tata Kiss János Tóth Elek Nagy Béla
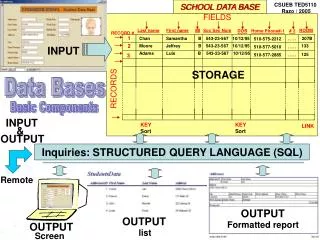
Relations database • You use databases to organize and relate tables • Databases provide the architecture for storing your data and have additional benefits as well. • More details in the next lecture
Goals of the database design process: • understand your data and why you’re tracking it • • eliminate duplication of data • • eliminate redundant data • • eliminate meaningless data or data we don’t care about • • promote accuracy of data • • promote consistency of data • • make sure we can retrieve the information we need from the database • • support the business functions that use the database • • build a database that lends itself to future growth
Entity Relationship Diagrams(ERD) • What is an ERD? An entity-relationship diagram is a data modeling technique that creates a graphical representation of the entities, and the relationships between entities, within an information system.
Base Feaures of the ERD • Simple, visual, graphical device • The models most important parts are the entities and the relationships • It is built from the attributes of the entities
Entity • An entity is an object or concept about which you want to store information.
Description of the Entities The common description of the entity is a rectangle, which contains the name of the entity: Owner Dog
Type of the Entities EntityAn entity is an object or concept about which you want to store information Weak EntityA weak entity is dependent on another entity to exist.
Attributes • Attributes are the properties or characteristics of an entity.
Description of the Attributes We can describe the attributes of the entity with a connecting ellipse: Date of birth Name Place of birth Sex Person
Types of the Attributes • AttributesAttributes are the properties or characteristics of an entity. • Key attributeA key attribute is the unique, distinguishing characteristic of the entity. For example, an employee's social security number might be the employee's key attribute.
Types of the Attributes • A multivalued attribute can have more than one value. For example, an employee entity can have multiple skill values. • Derived attributeA derived attribute is based on another attribute. For example, an employee's monthly salary is based on the employee's annual salary.
Relationships • Relationships illustrate how two entities share information in the database structure.
Description of the Relationships We can describe the relationship of the entity with a rhombus. We can mark the type of the relationship as well. 1 N Dog has Man If an entity takes part in a connection only partly, we describe it with single line, (Not all men have dogs), if it takes part totally we describe it with a bold line.( We don’t respect the stray dogs)
Types of the Relationship • RelationshipsRelationships illustrate how two entities share information in the database structure. • Weak relationshipTo connect a weak entity with others, you should use a weak relationship notation.
Cardinality Cardinality specifies how many instances of an entity relate to one instance of another entity.
Cardinality • 1:1 (wife-husband) • 1: N (mother-children) • N:M (grandparents-grandchildren)
1 M N N Employs Employs Department Department Employees Employees 1 Department may employ Many Employees 1 Employee only has one department Examples - Relationship The diagram changes according to your real situation. You may also allow 1 Employee to work for Many Departments
Participation • Total participation • Every child has a mother • Partial participation • Not every woman has a child
1 N Employs Department Employees Every department must have at least one employee. An employee need not work for any department. Indicate partial participation by using Example - Participation
Recursive relationshipIn some cases, entities can be self-linked. For example, employees can supervise other employees.
Attributes LName FName ID Address Entity Take Entity Description CNum CName Attributes Relationship Courses Students
Simplified car selling model Years Name 1 N buy Car Customer Type Address Price Driving licence
Data Problems: - don’t give back the relationships - repeating data… We have to study….
Customer Years Name N N Car Selling Customer Type Car Price Extension of the model 1 1 sell buy Address Driving licence Date