Download
1 / 42
420 likes | 520 Views
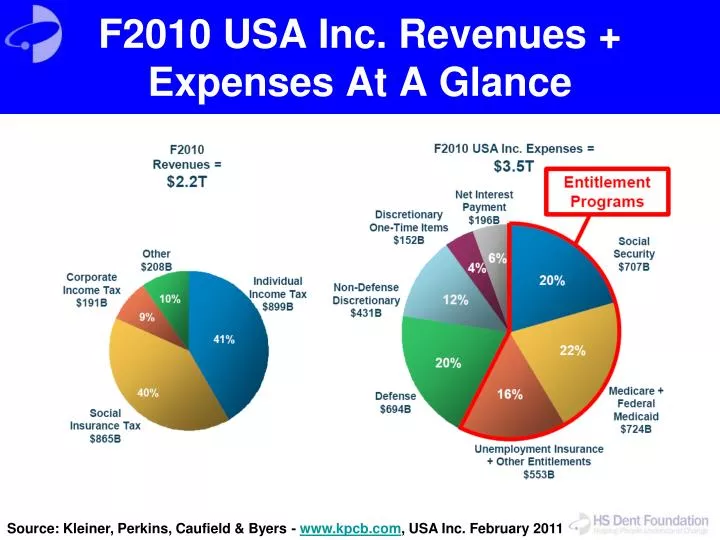
F2010 USA Inc. Revenues + Expenses At A Glance. Source: Kleiner, Perkins, Caufield & Byers - www.kpcb.com , USA Inc. February 2011.

E N D
F2010 USA Inc. Revenues + Expenses At A Glance Source: Kleiner, Perkins, Caufield & Byers - www.kpcb.com, USA Inc. February 2011
Unfunded Entitlement (Medicare + Social Security) + UnderfundedEntitlement Expenditures (Medicaid) = Among Largest Long-Term Liabilities on USA Inc.'s Balance Sheet Source: Kleiner, Perkins, Caufield & Byers - www.kpcb.com, USA Inc. February 2011
Total Government* Healthcare Spending Increases are Staggering Up 7x as % of GDP Over Five Decades vs. Education Spending Only Up 0.6x Source: Kleiner, Perkins, Caufield & Byers - www.kpcb.com, USA Inc. February 2011
Federal Government Spending Had Risen to 24% of GDP in 2010, Up From an Average of 3%From1790to1930 Source: Kleiner, Perkins, Caufield & Byers - www.kpcb.com, USA Inc. February 2011
Entitlement Spending Increased 11xWhile Real GDP Grew 3x Over Past 45 Years Source: Kleiner, Perkins, Caufield & Byers - www.kpcb.com, USA Inc. February 2011
Entitlement Spending + Interest Payments Alone Should Exceed USA Inc. Total Revenue by 2025E, per CBO Source: Kleiner, Perkins, Caufield & Byers - www.kpcb.com, USA Inc. February 2011
America’s Resources Allocated to Housing + Healthcare Nearly Doubled as a Percent of GDP Since 1965, While Household and Government Savings Fell Dramatically Source: Kleiner, Perkins, Caufield & Byers - www.kpcb.com, USA Inc. February 2011
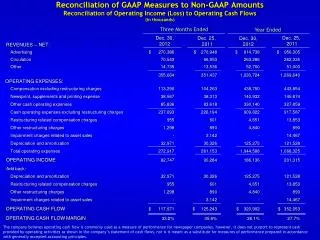
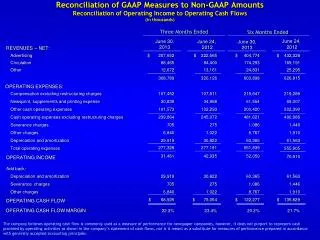
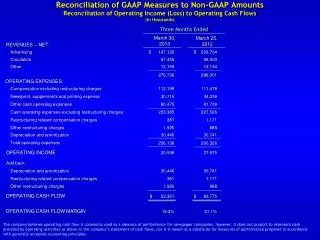
Income Statement –F2010 USA Inc. Revenues + Expenses at a Glance Source: Kleiner, Perkins, Caufield & Byers - www.kpcb.com, USA Inc. February 2011
Defense Spending Has Risen,Driven by Wars in Afghanistan + Iraq Source: Kleiner, Perkins, Caufield & Byers - www.kpcb.com, USA Inc. February 2011
While USA Inc. Ranks # 1 in Defense Spending; Top 25 Countries, 2009 Source: Kleiner, Perkins, Caufield & Byers - www.kpcb.com, USA Inc. February 2011
USA Inc. Ranks # 6 in Defense Spending as Percent of GDP; Top 25 Countries Percent of GDP, 2009 Source: Kleiner, Perkins, Caufield & Byers - www.kpcb.com, USA Inc. February 2011
Entitlement Spending: 76% Is Directed to Social Security +Medicare + Medicaid Source: Kleiner, Perkins, Caufield & Byers - www.kpcb.com, USA Inc. February 2011
Entitlement Spending: Social Security Funding Has Worked, So Far While Medicare/Medicaid Are Underfunded by $5.6 Trillion Since Inception in 1965 Source: Kleiner, Perkins, Caufield & Byers - www.kpcb.com, USA Inc. February 2011
Entitlement Spending: Social Security Funding Has Worked, So Far While Medicare/Medicaid Are Underfunded by $5.6 Trillion Since Inception in 1965 Source: Kleiner, Perkins, Caufield & Byers - www.kpcb.com, USA Inc. February 2011
Entitlement Spending: Program Beneficiaries (Now29%*of Population vs.13%* in 1966) Have Grown Faster than Population Owing to Aging Population + Expanded Eligibility Source: Kleiner, Perkins, Caufield & Byers - www.kpcb.com, USA Inc. February 2011
Entitlement Spending: While Beneficiaries From Aging PopulationRose 2x From 1966 to 2009, Beneficiaries From Expanded Eligibility (Low-Income / Disabled) Rose 10x Source: Kleiner, Perkins, Caufield & Byers - www.kpcb.com, USA Inc. February 2011
Entitlement Spending: Entitlement Program + Government Employee Beneficiaries Are Now 36%* of Population vs. 20%* in 1966 Source: Kleiner, Perkins, Caufield & Byers - www.kpcb.com, USA Inc. February 2011
Entitlement Spending: Rising Entitlement Income IsHighly Correlated (82%) with Falling Personal Savings Source: Kleiner, Perkins, Caufield & Byers - www.kpcb.com, USA Inc. February 2011
Medicaid: Underfunded by $3.7 Trillion Over 45 Years, With No Dedicated Funding Source: Kleiner, Perkins, Caufield & Byers - www.kpcb.com, USA Inc. February 2011
USA Healthcare Spending Is Higher Than All Other OECD Countries Combined(with 35% of Other OECD Countries’ Combined Population) Source: Kleiner, Perkins, Caufield & Byers - www.kpcb.com, USA Inc. February 2011
USA Per Capita Spending on Healthcare = 3x OECD Average Source: Kleiner, Perkins, Caufield & Byers - www.kpcb.com, USA Inc. February 2011
USA Spending on Healthcare as % of GDP = 2x OECD Average Source: Kleiner, Perkins, Caufield & Byers - www.kpcb.com, USA Inc. February 2011
USA Spending on Healthcare IS NOT Performance-Based and IS NOT Correlated to Longer Life Expectancy Source: Kleiner, Perkins, Caufield & Byers - www.kpcb.com, USA Inc. February 2011
If History is a Guide, There is Potential for Estimates to Understate Eventual Costs – Medicare Is 10x Higher Than Spending Forecast Source: Kleiner, Perkins, Caufield & Byers - www.kpcb.com, USA Inc. February 2011
Social Security: Each Retiree Was Supported by 42 Workers in 1945 & Just 3 Workers in 2009 Source: Kleiner, Perkins, Caufield & Byers - www.kpcb.com, USA Inc. February 2011
Americans Are Living 26% Longer, But Social Security ‘Retirement Age’ Has Increased Only 3% Since Social Security Was Created in 1935 Source: Kleiner, Perkins, Caufield & Byers - www.kpcb.com, USA Inc. February 2011
Debt Level: Why It Has Risen? Answer Part 2: Revenue (Esp. Corporate Taxes) Fell Below GDP Growth Source: Kleiner, Perkins, Caufield & Byers - www.kpcb.com, USA Inc. February 2011
Debt Level: Why Will It Continue to Rise?Answer Part 3: Potential Loss on Guarantees on Fannie Mae / Freddie Mac Originations Could Rise Source: Kleiner, Perkins, Caufield & Byers - www.kpcb.com, USA Inc. February 2011
Debt Level: GSEs’ Expansion Into ‘Non-Conventional’ Mortgage LendingBusiness Has Proved to Be Costly So Far Source: Kleiner, Perkins, Caufield & Byers - www.kpcb.com, USA Inc. February 2011
Effective Interest Rates: While USA Debt Has Risen, Net Interest Payments Have Fallen Source: Kleiner, Perkins, Caufield & Byers - www.kpcb.com, USA Inc. February 2011
Effective Interest Rates: Hypothetical Exercise – If USA 2009 Cost of DebtWas Paid at 30-Year Average Interest Rate Level of 6% vs. Current 2%,Annual Interest Cost Would Rise 3x to $566 Billion from $196 Billion Source: Kleiner, Perkins, Caufield & Byers - www.kpcb.com, USA Inc. February 2011
Debt Composition: Foreign Investors & Governments Hold ~46% of USA Inc. Public Debt Source: Kleiner, Perkins, Caufield & Byers - www.kpcb.com, USA Inc. February 2011
Debt Composition: Foreign Investors & Governments Hold 46% of USA Inc.Public Debt, Up From 4% in 1970 – How Much Higher Should It Go? Source: Kleiner, Perkins, Caufield & Byers - www.kpcb.com, USA Inc. February 2011
Entitlement Spending + Interest Payments Alone Should Exceed USA Inc. Total Revenue by 2025E! Source: USA, Inc. Summary; www.kpcb.com
Real Estate Bubble: Root Causes—Government Home Ownership Push +Declining Interest & Savings Rates + Aggressive Borrowing and Lending Led to 10+ Years of Rising Home Ownership Source: Kleiner, Perkins, Caufield & Byers - www.kpcb.com, USA Inc. February 2011
Real Estate Bubble: Home Prices Rose Dramatically (7% Annually) for 10 Years – Up ~2x Over 10-Year Period Ending 2007 Source: Kleiner, Perkins, Caufield & Byers - www.kpcb.com, USA Inc. February 2011
Banks & Other Mortgage Originators Helped Fuel Housing Bubble as They Originated Lower Quality Mortgages – Alt-A & Subprime Origination Volumes Up 374% & 94% in 2006 vs. 2003 Source: Kleiner, Perkins, Caufield & Byers - www.kpcb.com, USA Inc. February 2011
Real Estate Bubble: Investors Helped Fuel It, Too, as They Reached For Yield Without Questioning AAA Ratings of A Subprime-Backed Investments Source: Kleiner, Perkins, Caufield & Byers - www.kpcb.com, USA Inc. February 2011
TARP Distribution –Equally Distributed Among Financial Institutions / Automakers / Insurer / Individuals as of 2/11 Source: Kleiner, Perkins, Caufield & Byers - www.kpcb.com, USA Inc. February 2011
Fannie Mae & Freddie Mac: Accounted for Majority of Total Residential Mortgage-Backed Securities (RMBS) Issuance Since 1990s Source: Kleiner, Perkins, Caufield & Byers - www.kpcb.com, USA Inc. February 2011
Balance Sheet: USA Inc. Total Liabilities: $47 Trillion in F2010 Up 5x From 1996, Driven by Medicare Liabilities Source: Kleiner, Perkins, Caufield & Byers - www.kpcb.com, USA Inc. February 2011
Bad News: USA Inc.’s Entitlement Programs are Inflation Indexed,Thus Potential Inflation – Which Would Reduce General Consumer Purchasing Power – Would Not Reduce Entitlement Liabilities Source: Kleiner, Perkins, Caufield & Byers - www.kpcb.com, USA Inc. February 2011