Download
1 / 19
190 likes | 298 Views
Experience nearly 1500 successful FHD deployments for Eddy Watch, including applications in hurricane tracking, oil spill response, and more. Find advanced shipboard survey examples and EddyNet charts for ocean monitoring. Access EDDY THE VISION data on pressure, wind, temperature, salinity, and currents. Utilize EDDY WATCH for Eddy Forecast Models and get downtime insights. Benefit from interactions with GCOOS for data utilization, historical databases, cost-effective solutions, and industry partnerships.

E N D
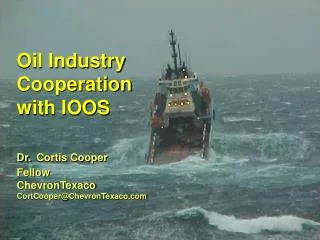
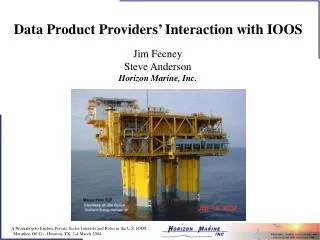
Data Product Providers’ Interaction with IOOS Jim FeeneySteve AndersonHorizon Marine, Inc.
FHD • EXPERIENCE • Nearly 1500 FHDs successfully deployed at sea • Eddy Watch – GOM (1350) • Eddy Watch – Trinidad (30) • Hurricane • Oil Spill • Search & Rescue • Ring & Eddy Surveys • Vessel Tracking • Instrument Recovery • Plankton Studies, etc.
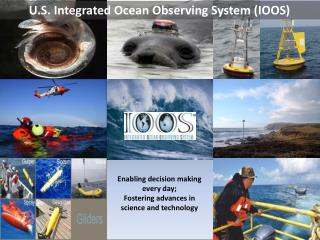
THE VISIONOcean Observing System Pressure Wind Air Temperature Ocean Temperature Ocean Salinity Currents Date Wind Wave Current ATM SST Pressure Day-Month- Speed Direction Height Period Speed (kts) Direction (millibars) (°C) Year-Hour (kts) (deg) (m) (sec) @ surface (deg) 15-Jan-2004 18 070° 2.72 6.9 0.87 015° 1006 23.7° 00:00 15-Jan-2004 01:00 20 072° 2.70 6.9 0.83 022° 1005 23.9° 15-Jan-2004 02:00 23 068° 2.71 6.9 0.88 018° 1006 23.8° Surface Analysis Wind/Wave Charts Surface Currents Current Profiles
EDDY WATCH – EDDY FORECAST MODEL Downtime DOWNTIME
Remote sensing. In situ data from Ocean Observing System. Dynamical nowcast/forecast models. Open-access for all users to publicly funded raw and processed real-time data feeds. Interactions with GCOOS:Data products we can readily utilize.
Our experience. Historical databases. Cost effective solutions and support for operational observing systems. Advocacy. Interactions with GCOOS:What can industry provide?
Data and program management. Value-added services. Hardware development and sales. Field support. Interactions with GCOOS:New business opportunities
Good communications! A voice in planning and governance. Assurance that we can compete openly on new opportunities. Interactions with GCOOS