Download
1 / 1
10 likes | 197 Views
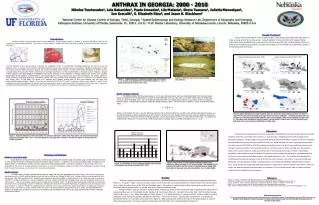
ANTHRAX IN GEORGIA: 2000 - 2010. Nikoloz Tsertsvadze 1 , Lela Bakanidze 1 , Paata Imnadze 1 , Lile Malania 1 , Shota Tsanava 1 , Julietta Manvelyan 1 , Ian Kracalik 2 , S. Elizabeth Rácz 3 , and Jason K. Blackburn 2

E N D
ANTHRAX IN GEORGIA: 2000 - 2010 NikolozTsertsvadze1, Lela Bakanidze1, PaataImnadze1, LileMalania1, ShotaTsanava1, JuliettaManvelyan1, Ian Kracalik2, S. Elizabeth Rácz3, and Jason K. Blackburn2 1National Center for Disease Control of Georgia, Tbilisi, Georgia; 2 Spatial Epidemiology and Ecology Research Lab, Department of Geography and Emerging Pathogens Institute, University of Florida, Gainesville, FL, 32611, U.S.A.;3H.W. Manter Laboratory, University of Nebraska-Lincoln, Lincoln, Nebraska, 65855 U.S.A Introduction Bacillus anthracis, a gram-positive spore-forming bacterium, is the causative agent of anthrax, a zoonosis that affects many of the world’s wild and domestic ungulates. The spores are highly stable in alkaline soils with high organic matter, prolonging subsequent exposure and cases. The first reported human case of anthrax in Georgia was registered in 1697 in a handwritten monolingual dictionary. For over 60 years, the National Center for Disease Control (NCDC) and Public Health of Georgia have conducted anthrax surveillance. Identifying populations in high-risk areas is of public health importance because the disease secondarily infects humans. Uncovering the spatial distribution of anthrax cases is a crucial aspect of ensuring the efficient distribution of necessary prophylaxis and the implementation of adequate control measures. Jacquez (1996) suggests that epidemiological investigations that include analyses for the detection of disease clusters may provide more accurate assessments of risk related to environmental or socio-cultural factors. Previous studies have shown that investigating the spatial pattern of health events by integrating geographic information systems (GIS) may provide crucial information as to the occurrence of a disease (Tango and Takashi 2005). In this study, 172 strains of B. anthracis were isolated, among them 70 were from humans, and 102 were from environmental samples (Figure 1 and 2). During the last decade (2000-2010), 370 cases of cutaneous anthrax were reported in adults. Small outbreaks occurred, but generally only sporadic cases were reported; 3 cases in total proved fatal. The purpose of this study was to analyze an describe the spatial distribution of anthrax Georgia in order to determine the presence of clustering among human cases. Results Continued Results from the LISA analysis on the smoothed incidence data indicates the presence high-high clusters or hotspots during each of the two time periods. Hotspots identified in time period 2000-2005 included: Martvili, Chkhorotsku, Khobi, Akhalkalaki, and Lanchkhuti, and in the time period 2006-2010 included: Akhalgori (Figure 5). Areas of low-low spatial autocorrelationor cold spots were located in the northwestern and southwestern portion of Georgia during both time periods. B. anthracis- bacterium B. anthracis – colony morphology A B Cutaneous anthrax C D Example of field sites where environmental isolates were obtained. Figure 2. Spatial distribution of laboratory isolates taken from humans n =70, in green, and obtained from environmental samples n = 102, in yellow, during the time period 2000 – 2010. Spatial Analysis continued The statistic can also identify spatial outliers, or in this case individual rayons, that vary disproportionately from the global mean. Rayons are deemed to be not significant or a cluster of either High-High, Low-Low, High-Low, or Low-High values relative to neighboring rayons at a given probability level. The null hypothesis states that there is no spatial autocorrelation or association of anthrax outbreaks between rayons. The alternative hypothesis states that spatial clustering exists. The local Moran’s I statistic is written as (following Anselin, 1995): where Ii is the statistic for rayon i, Zi is the difference between the smoothed incidence at iand the mean anthrax outbreaks for Georgia, Zj is the difference between anthrax outbreaks at j and the mean for Georgia. Wij is the weights matrix that only considers neighbors that share a common border or vertices (in the Rook contiguity case Wij is 1/n if a rayon shares a border or a vertex and zero otherwise). The statistic was implemented in GeoDa0.9.5-i (Anselin et al., 2006) using a Queen contiguity matrix, and 999 permutations at an α < 0.05. E F Figure 5. Spatial distribution of average incidence rates per 100,000 for human cutaneous anthrax are shown in map A for the time period 2000-2005 and map B for the time period 2006-2010 . Smoothed incidence rates per 100,000 were calculated using an SEBS algorithm with a Rook contiguity matrix and are displayed in maps C and D. LISA values were calculated for each time period and are shown in maps E and F with red portraying High-High areas, blue Low-Low areas and light blue Low-High areas. Environmental Isolates Human Isolates Discussion The analyses and mapping used in this study reveal areas of increased risk for human cutaneous anthrax in Georgia. Identifying areas with an increased risk for disease is an important step in establishing public health management and intervention strategies. Average incidence during the time periods illustrate that the areas of highest risk were not necessarily associated with areas reporting the highest number of cases. The spatial distribution of rayons reporting anthrax increased from the time period 2000-2005 to 2006-2010 indicating a possible increase in risk due to some underlying process such as changes in livestock production, food handling/consumption. While the number of rayons reporting cases may be due to these or other unknown factors is unclear since the increase in reporting could be a product of better record keeping, surveillance, and/or awareness about the disease. Smoothed rate further revealed that adjusting for population variance at the local level may provide a more stable depiction of the spatial distribution of risk. The smoothed rates decreased the intra-time period variation among rates as well as the inter-time period variation in the number of rayons producing rates. Additionally, the LISA analysis was useful in elucidating areas or rayons that had statistically significant higher smoothed rates. Locating areas that indicate statistically high proportion of cases may be useful for targeting control efforts. While the human case data has provided useful information on the patterns of risk in Georgia including data on livestock infections could also help in establishing control measures. Figure 4. Total number of positive human cutaneousanthrax cases reported by village and rayon n=370 across Georgia. Red graduated circle represent the location and the number of reported cases by village while the number of cases per rayon are colored white (low ) to black (high). Figure 3. Total number of human cutaneous anthrax cases reported in Georgia by year during the period 2000 - 2010. Figure 1. Temporal distribution of the total number of B. anthracis laboratory isolates taken from human and environmental samples during the time period 2000 - 2010. Line colors displayed in the graph above represent the different regions of Georgia where the isolates originated. Total Number of Isolates Materials and Methods Anthrax occurrence data A GIS database totaling 370 human cases of anthrax geo-located to the nearest village was created using surveillance data from 2000 to 2010 collected by a team of Georgian scientists from NCDC (Figure 3 and 4). In addition to the human surveillance data, information on the spatial location of environmental samples was also obtained from field sampling efforts. Laboratory investigations (bacteriology, PCR) were conducted on 359 cases; 32 % were laboratory confirmed, 6 % were not investigated. Overall, 172 strains of B. anthracis were isolated, among them 70 were from humans, and 102 were from environmental samples. Spatial Analysis The total number of newly reported anthrax cases by village and year were aggregated at the rayon level. Rayon-level incidence was calculated using the GRUMP gridded population and local census data across Georgia for each year. Average incidence was calculated for the time periods 2000-2005 and 2006-2010. Spatial Empirical Bayesian Smoothing (SEBS) in GeoDa (Anselin et al. 2006) was used to account for instability in incidence estimates as a result of population variance. Spatial smoothing was calculated using case and population numbers from a given rayon iand its surrounding neighbor rayons j using a Rook contiguity matrix. In general Empirical Bayesian smoothing prior estimates are derived from a global mean, however in SEBS prior estimates are taken from the spatial relationship of spatial unit iand all j neighbors that share a border. In order to identify the possible presence clustering in the human anthrax case data a local indicator of spatial autocorrelation known as the Local Moran’s I (LISA) (Anselin 1995) was used in the Geoda software package (Anselin et la. 2005). Thistest evaluates the existence of spatial autocorrelation or local clusters by examining the contribution of a rayon to the global autocorrelation Moran’s I statistics for the entire country. Results Preliminary mapping of isolates obtained from human and environmental samples across Georgia indicated similar geographic distributions (Figure 2). The graph in Figure 1 shows that a large number of both human and environmental isolates were obtained from the KevmoKarti oblast, which includes the urban centers of the Tbilisi and Gardabani rayons. The number of reported human anthrax cases was also greatest in KevmoKarti oblast with the highest number of reported cases in the Tbilisi and Gardabani rayons. Average incidence rates per 100,000 for reported human anthrax cases during the time period 2000-2005 illustrate that the highest rates of cutaneous anthrax were in the Akhalkalki, Senaki, Kazbegi, and Tianeti rayons (Figure 5). During the time period 2006 -2010 the highest average incidence rates were in Java, Tsalka, Samtredia, and Tianeti(Figure 5). The spatial distribution of cutaneous anthrax incidence displays a growing geographic extent between the periods 2000-2005 and 2006-2010. The number of rayons reporting cases increased from n=25 during the period 2000-2005 to n=37 during the period 2006-2010. (Figure 4). SEBS smoothed rates showed a decrease in the spatial variation of incidence rates across Georgia with n=61 rayons eliciting smoothed rates during 2000-2005 and n=64 during 2006-2010 (Figure 5). References Anselin, Luc. 1995. Local indicators of spatial autocorrelation. Geographical Analysis. 27:93-115. Anselin, Luc, I. Syabri, and Y. Kho. 2006. GeoDa: An introduction to spatial data analysis. Geographical Analysis. 38:5–22. Jacquez, Geoffrey M. 1996. A k nearest neighbor test for space-time interaction. Statisticsin Medicine. 15:1935-1949. Beyer, H. L. 2004. Hawth's Analysis Tools for ArcGIS. Available at http://www.spatialecology.com/htools. Tango, Toshiro and Kunihiko Takashi. 2005. A flexibility shaped scan for detecting clusters. International Journal of Health Geographics. 11(4). Acknowledgements This Cooperative Biological Research project was funded by the United States Defense Threat Reduction Agency (DTRA) as part of the Biological Threat Reduction Program in Georgia. UF funding is administered through the Joint University Partnership under the University of New Mexico.