Download

1 / 33
330 likes | 456 Views
Goods Movement in the SCAG Region. Major Gateway for International Commerce Ports of Long Beach and Los Angeles account for 87 percent of State’s container volume Tremendous Freight Infrastructure Development

E N D
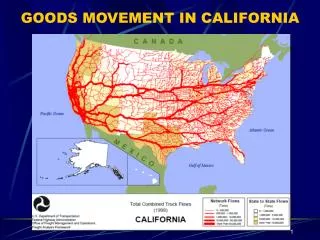
Goods Movement in theSCAG Region Major Gateway for International Commerce Ports of Long Beach and Los Angeles account for 87 percent of State’s container volume Tremendous Freight Infrastructure Development Ports, airports, border crossings, highways, rail and intermodal terminals Major Role of Freight/Logistics in National, State and Regional Economies One out of every seven jobs in Southern California depends on trade Existing Infrastructure is Reaching Capacity System is already straining to keep pace with current demand All Projections Point to Continued Robust Growth in Goods Movement Volumes Container goods movement through the Ports of Los Angeles and Long Beach expected to increase from a combined 11.8 million TEUs in 2003 to around 44.7 million TEUs in 2030 Associated Increase in Demand on Transportation System Truck VMT expected to increase 110% by 2030 Growing Concern Regarding Side Effects of Goods Movement Issues of community health, air pollution and congestion are foremost
SCAG StudiesCompleted SR-60 Truck Lane Feasibility Study Concluded that dedicated truck lanes between I-710 and I-15 were feasible Goods Movement White Paper Survey of regional initiatives & discussed program objectives Truck Count Study Conducted 24-hour, observed counts at over 150 highway locations throughout the region LA-Inland Empire Railroad Mainline Advance Planning Study Forecasted year 2025 Rail Capacity Needs Empty Container Study 5-10% of empty containers can be reloaded for export
Studies Completed(Continued) Logistics and Distribution: An Answer to Regional Upward Social Mobility Logistics industry accounts for 1 in 7 (550,000) jobs in the region Replaces lost manufacturing jobs and at a higher pay level Port and Modal Elasticity Study Measured impact of user fees on cargo volumes at the LA/LB Ports Concluded that container charges resulting in congestion relief would reduce volume by only 4.3% I-15 Comprehensive Corridor Study Evaluated the feasibility, options, and costs of implementing truck lanes along the I-15 corridor between SR-60 interchange and the Mojave River crossing in Victorville. Proposed the development of dedicated truck lanes for the full length of the study area as a goods movement enhancement strategy along the I-15 corridor.
Studies Underway Multi-County and State Goods Movement Action Plans Regionwide & Statewide strategies and solution sets Inland Port Feasibility Study Feasibility of shifting the storage & sorting of containers inland Port & Modal Elasticity Study Phase II Measuring freight diversion in the short run Env. Mitigation for Goods Movement Most cost-effective air quality mitigation strategies Alternative Technologies Feasibility of alternative cargo conveyance systems
Input Alternatives for 2008 RTP State GMAP Multi-County GMAP 2007 AQMP POLA/POLB Master Plans BNSF/UP Capital Plans Additional inputs: Infrastructure Enhancements Environmental Mitigations Institutional/Legal/Financial Alternative Freight Transport Tech
Entry of Goods in Region Ocean Carriers Inland-point Intermodal Service Transportation to the Port Gate with a Container Mounted on a Chassis Transportation to Inland Warehouses Air Cargo Railroads Trucking
PortsLos Angeles and Long Beach Largest National Container Port Complex Fifth Largest Container Port Complex in World 15.7 million Twenty-Foot Equivalent Units (TEUs) of containers in 2006 Approximately 40,000 TEUs units move every day through the ports
PortsLos Angeles and Long Beach Fourth largest Nationwide in tonnage of bulk and break-bulk commodities (including automobiles and liquid bulk) Total of 135 million tons in 2005 The ports handled a total of close to 352 million metric revenue tons of cargo in 2006 (including containers) Sources: Port of Los Angeles 2006 Financial Statement; and Port of Long Beach 2006 Monthly Tonnage Summary Reports.
Container Traffic at California Ports 1984-2006 (Millions of TEUs)
Waterfront Coalition White Paper, May 2005 “Regardless of efforts to develop alternative West Coast gateways, Los Angeles and Long Beach will remain the primary entry points for eastbound imports into the U.S.”
Trade and Trade Growth Issues/Impacts • Impacts • Growing congestion: 110% more trucks on roads by 2030 • Air quality concerns: DPM and NOx growth • Health concerns: Increasing rates of cancer, asthma • Positive Contributions • Jobs: 1.4 million people employed in 2005 • Regional, state, and national economic engine: Created $113 billion in economic value in 2005 • Issues • Terminal capacity expansion needs • On-dock rail needed • Port contribution to regional transportation system
Recent Actions to Combat Impacts/Issues • PierPass OffPeak project • San Pedro Bay Ports Clean Air Action Plan (CAAP) • Alameda Corridor • Gateway Cities Truck Replacement Initiative • On-Dock rail increase to 20% • Development and test deployment of Virtual Container Yard • Study of advanced, low-emissions container transportation technologies
On- and Off-Port Infrastructure Improvements:$20.2 billion in Needed Projects San Pedro Bay Ports Area Port of Oakland Area California’s Smaller Ports
RAIL • Carload and Intermodal Volume uses eight UP/BNSF Terminals • 64% Intermodal • 36% Domestic (carload) • Nation’s #1 Rail Intermodal Operation • 5 million containers annually • Projected to double by 2025 • Carload traffic • Represents about one-third of the rail goods movement in the study area= 88 trains/ day or 32,000/year
Terminal Capacity Issues Hobart Yard is at Capacity, BNSF needs new yard to support growth On-dock intermodal terminal needs Near-dock intermodal terminal needs
Truck Volume on Southern California Freeways In thousands Freeway 2002 2025 I - 110 18.6 39.1I - 405 22.3 42.6I - 10 20.4 43.3U.S. 101 20.7 43.4I - 105 26.1 54.9I - 5 40.9 85.9I - 710 47.3 99.3CA - 60 50.4 105.8 110%Average Increase
Truck Counts by Type AcrossSCAG Region Source: SCAG Goods Movement Truck County Study, 2002.
2003 Daily Truck and Total Vehicle Miles of Travel by District and County Source: Truck Miles of Travel: California State Highway System 1988-2003, Caltrans, 2005.
Economic Imperative:Improving Job Opportunities High wages for California workers ($45K per year average) Trade jobs – one of every seven in California California Trade – 40% of the national total 2002 trade disruption cost $7+ billion nationally
Environmental Impacts of Goods Movement • Goods movement (GM) in Southern California a major source of air pollution • Major GM sources of pollutant emissions in the region: Over-the-road trucks, rail locomotives, idling trucks/locomotives, yard and terminal equipment, and ships • GM also having other environmental impacts in the region in terms of noise and water pollution. • Noise from terminal/yard equipment • Locomotive horns at grade crossings • Water pollution through run-offs at seaports and other goods movement terminals/yards. • Dredging activity at seaports also a major cause of water pollution
Environmental Impacts of Goods Movement 2008 Estimated Annual Average Emissionsin South Coast Air Basin Source: Draft 2007 Air Quality Management Plan, South Coast Air Quality Management District.
Public Health Imperative:Reducing Port-Related Air Pollution Majority of emissions are from mobile sources, including ships Goods movement is a key contributor to air pollution and disease Diesel PM: A toxic air contaminant Without new control strategies, more cargo means more pollution
Contribution of Port-Related Sources to Regional Diesel PM 24% 49% 32%
Environmental Enhancements • The Ports of Long Beach and Los Angeles Clean Air Action Plan • The Port of Oakland’s Vision 2000 Maritime Development Program • The State Goods Movement Action Plan and the California Air Resources Board Emission Reduction Plan
Funding Limitations Crisis • Highway gas tax • SAFETEA-LU • State diversion of transportation dollars • Federal non-responsiveness Opportunity • Proposition 1B: $19.925 billion in State General Obligation bonds for transportation • Coalition Building: Public-Private Partnerships • The Waterfront Coalition • West Coast Corridor Coalition