Download
1 / 1
10 likes | 196 Views
Figure K1: Stylised electricity supply chain. Generator. Generator substation. 500kV. 500kV line. 0. 500:230kV substation. 14049. 230kV. 13653. 396. 230kV line. 13421. 13421. 0. 230kV:HV substation. 13402. 5358. HV. 8044. HV line. 5142. 4455. 687. HV:MV substation. 4441.

E N D
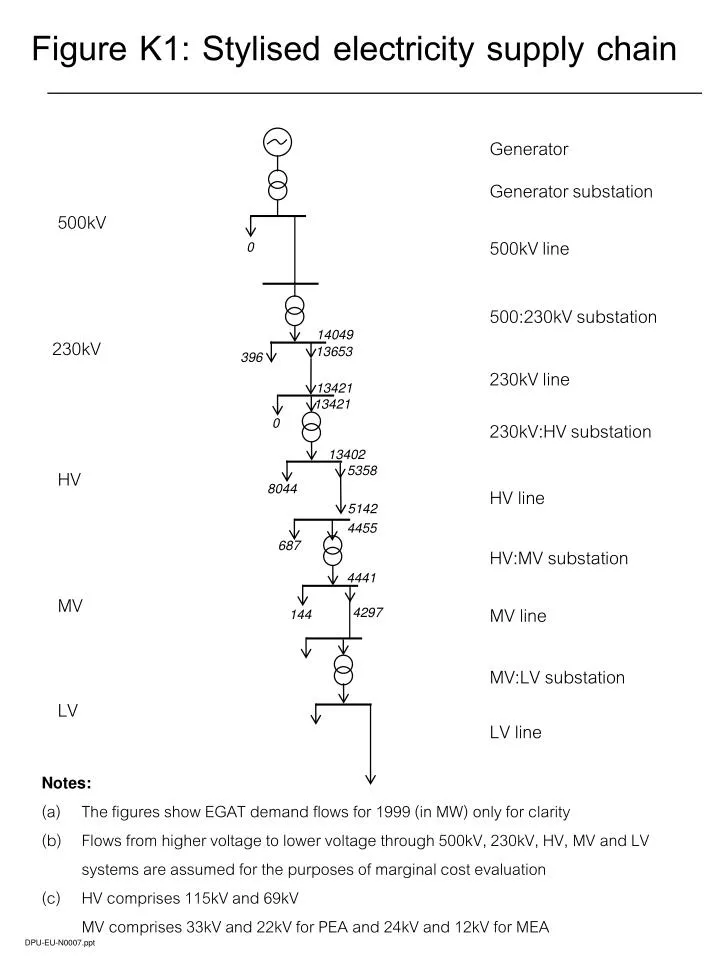
Figure K1: Stylised electricity supply chain Generator Generatorsubstation 500kV 500kVline 0 500:230kV substation 14049 230kV 13653 396 230kV line 13421 13421 0 230kV:HV substation 13402 5358 HV 8044 HV line 5142 4455 687 HV:MV substation 4441 MV MV line 4297 144 MV:LV substation LV LV line Notes: (a) The figures show EGAT demand flows for 1999 (in MW) only for clarity (b) Flows from higher voltage to lower voltage through 500kV, 230kV, HV, MV and LV systems are assumed for the purposes of marginal cost evaluation (c) HV comprises 115kV and 69kV MV comprises 33kV and 22kV for PEA and 24kV and 12kV for MEA