Download
1 / 21
210 likes | 484 Views
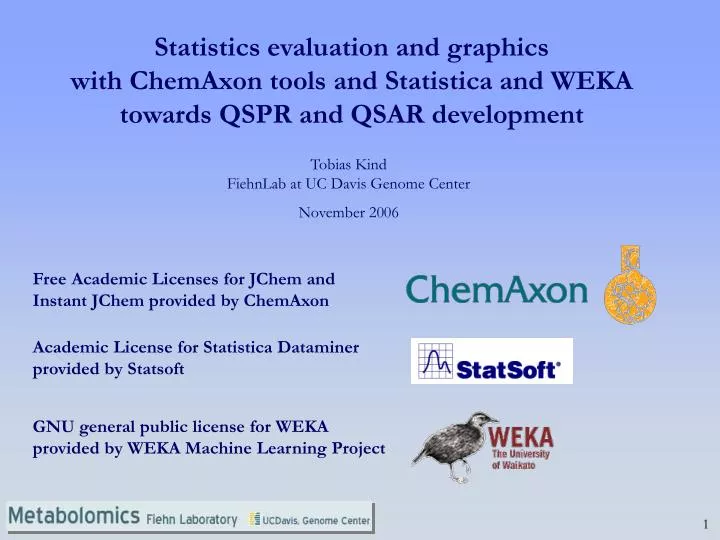
Statistics evaluation and graphics with ChemAxon tools and Statistica and WEKA towards QSPR and QSAR development. Tobias Kind FiehnLab at UC Davis Genome Center November 2006. Free Academic Licenses for JChem and Instant JChem provided by ChemAxon.

E N D
Statistics evaluation and graphics with ChemAxon tools and Statistica and WEKA towards QSPR and QSAR development Tobias Kind FiehnLab at UC Davis Genome Center November 2006 Free Academic Licenses for JChem and Instant JChem provided by ChemAxon Academic License for Statistica Dataminerprovided by Statsoft GNU general public license for WEKAprovided by WEKA Machine Learning Project
Metabolomics - The science of the small molecules • Compound Classes: • sugars • amino acids • steroids • fatty acids • lipids • phospholipids • organic acids ... Molecules under investigation Visit us! www.fiehnlab.ucdavis.edu 3D model of a molecule with surface plot
Techniques and tools • Analytical techniques (LC-MS, GC-MS, FT-MS, NMR, IR) • BioInformatics, ChomoInformatics Liquid ChromatographyLC-MS Gas ChromatographyGC-MS BioInformatics and CheminformaticsStatistics (Statistica Dataminer) Open Source Tools
ChemAxon JChem has now PCA and PLS • Create new library with JCHEM Manager GUI (testcase here: fingerprints) • Exctract fingerprints and do dimension reduction with principal component analysis (PCA) with command line tool PCA.bat or pca.sh
ChemAxon JChem Principal Component Analysis (PCA) Start PCA by getting information from DB (here Access, but can be Oracle, Derby, MySQL) Test case 250.000 chemicals from NCI DB PCA can be done from any descriptor, chemical fingerprints, BCUT etc.This is just a simple example made from the 16 standard fingerprints. Be sure only to select descriptors you want (and not the molecule ID) PCA -d "sun.jdbc.odbc.JdbcOdbcDriver" -u "jdbc:odbc:jchem-z" -l test -p test -P JChemProperties -q "SELECT cd_fp1, cd_fp2, cd_fp3, cd_fp4, cd_fp5, cd_fp6, cd_fp7, cd_fp8, cd_fp9, cd_fp10, cd_fp11, cd_fp12, cd_fp13, cd_fp14, cd_fp15, cd_fp16 FROM nci99 WHERE cd_id <= 250000" -o PCA-scores.txt -t PCA-Eigenvalues.txt TimeThis : Command Line : run-pca.bat TimeThis : Start Time : Mon Nov 27 17:02:02 2006 TimeThis : End Time : Mon Nov 27 17:19:52 2006 TimeThis : Elapsed Time : 00:17:49.812 Problem here: A) JDBC extraction not tuned - DB extraction of values nearly 2 minutes. B) PCA calculation time too long - 15 minutes for a matrix 250.000 x 16 The current PCA algorithm needs to be changed, its very inefficent (faster matrix routines exist for JAVA) Database extraction time with Statistica: 8 seconds. The same PCA with Statistica is finished in: 1 second (no joke – thats a factor of 1:900).
JChem PCA output The PCA results matrix is inverted and values *(-1) from Statistica. Problem: Currently no graphics. But multivariate statistics lives from graphics. Follwing simple graphic examples are made with Statistica or WEKA via DB query.
Following slides „What could be“ in the future. or „What can be done“ right now. Check the pretty comprehensive statistics link http://www.statsoft.com/textbook/stathome.html
Response curves PLS Tree model Cluster Analysis Neural Network Feature selection Machine Learning (KNN) Machine Learning and statistic tools We use Statistica Dataminer as a comprehensive statistics work tool.WEKA or YALE are free but (not yet :-) as powerful as the Statistica Dataminer.
Connection of a JCHEM molecule DB via JDBC with Statistica Time for query + copy of 4,000,000 values with 250k molecules 16 fingerprints = 8 seconds. Test system JChem 3.2 with MS Access with Statistica Dataminer 7.1 Dual Opteron 2.8 GHz
PCA Scree plot – determine optimal factors to retain Visible Step Statistica Dataminer 7.1 Four factors can be retained. The 16 dimensional space can be compressed into a 4-dimensional space. (Scree plot is not optimal here)
PCA Loadings plot – which variables are influential? Statistica Dataminer 7.1 Which of the 16 fingerprints are similar? Those who “cluster” together are similar (fp_11 and fp_14). The variables fp_5 and fp_16 influence factor 1 in the same way. Variables inside or near the center (0,0) have no discrimination power. Remember PCA is no cluster analysis!
PCA Scores plot – picture of the reduced dimensionality. Statistica Dataminer 7.1 The 16 fingerprints are compressed into 2D. We can use other high dimensionality descriptors for enhanced examples. Cases (molecules) which „cluster“ together may have same properties or functional groups (depending on input). Here we see the KOW molecule set covers the whole NCI dataset based on 16 pfs.
PCA Scores 3D plot – KOWWIN versus silicon compound test set Statistica Dataminer 7.1 The 16 fingerprints are compressed into 3D. The KOWWIN test set does not cover the whole molecules space of important silicon containing molecules. You can also do an Overlap Analysis (compare two databases) within the all-new Instant-JChem.
Statistica – Random Forest Machine learning 1024-DIM FC descriptor space Statistica generates all graphical output + SQL code Chemical fingerprint descriptors generated with JCHEM GenerateMDGenerateMD performance 1800 molecules/second for 1024 dimensional fp On Dual Opteron 2,8 GHz (one core used only).
CART tree method for QSPR and QSAR Classification trees, boosting trees, random forest, regression trees and honest trees and adaptive trees – lots of wood and forests - did you hear about them?
Other machine learning techniques from Statistica Dataminer we use Most of them work for classification and regression
Now with open source datamining tool WEKA URL SQL Data Yellow = OK Easy: enter DB URL, enter SQL statement, import data. Try free AquaStudio for SQL!
Conclusions regarding statistics: • JChem PCA and PLS output (Eigenvalues, scores, loadings) • are provided only as textfile. More univariate and multivariate tools needed. • JChem PCA and PLS results must have graphical output. (They must) • JChem PCA must be made faster (factor 600-1000) by using math routines. • Integration into Instant-JChem would be good or ChemAxon provides enhanced bundled statistics tools. • Currently JDBC query from JChem to other statistical packages like WEKA or Statistica or R or MATLAB or YALE is perfect. Each package works best in the field it was designed for.