Download
1 / 15
160 likes | 186 Views
Simulated Sea Surface Salinity Variability in the Tropical Pacific. Xiaochun Wang Yi Chao. JPL/Caltech. Terrain-Following Ocean Models User Workshop. Seattle , Aug. 4-6.

E N D
Simulated Sea Surface Salinity Variability in the Tropical Pacific Xiaochun Wang Yi Chao JPL/Caltech Terrain-Following Ocean Models User Workshop Seattle , Aug. 4-6 Acknowledgement: Discussions with J. McWilliams, P. Marchesiello, A. Shchepetkin , T. Song, Y. Golubev about the use of ROMS model. Computations were performed on computers of JPL and NASA Ames Research Center.
What is the Sea Surface Salinity (SSS) structure associated with the ENSO phenomenon? What are the detailed features of SSS seasonal cycle? Are there any salinity signatures associated with the Tropical Instability Waves (TIWs)? Scientific Issues
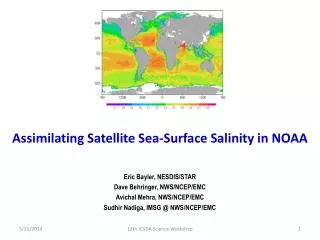
The effect of salinity on dynamics is gradually realized, e.g. barrier layer, influence on SSH, … However, salinity has very sparse observation. Aquarius mission, measure monthly SSS with accuracy of 0.2 psu with horizontal resolution of 100km Motivation
Horizontal resolution, 50km, 45S-65N, 99E-70W 20 S-coordinate levels KPP scheme Open boundary condition 1990-2001 NCEP-NCAR Daily Forcing (Wind stress, heatflux, precipitation and evaporation) 5-day (pentad) average Pacific ROMS (Regional Ocean Modeling System)
Validation of Model Simulation • TAO Data • 5-day • 99% Sig.
SSS Change on InterannualTimescale • 1-yr lowpassed • Freshening during ENSO
Spatial Pattern Associated with ENSO • EOF Analysis • Consistent with Ob. • Variance (24.9%)
Seasonal Cycle of SSS Annual Mean • EOF Analysis • Variance (66.0%) • ITCZ
SSS Features Associated with TIWs SSS SST and Current 50day Highpassed
SSS Features of TIWs • Westward Propagation • Seasonal Change • Intreannual Change • 50day Highpassed
Spatial Features of TIWs .Fresh .Warm .Upward .Southward .Eastward
Why TIWs SSS Variability is along EQ? Meridional Advection !
SSS Variability on Different Timescales Total Interannual Seasonal Intraseasonal (<50day)
The western tropical Pacific is a region of large variability on different timescales, interannual, seasonal, and intraseasonal. Though ENSO events show up as a freshening of the whole equatorial Pacific, the eastern equatorial Pacific is not a center of SSS variability on interannual timescale. On timescale shorter than 50days, besides the variability center in the western tropical Pacific, there is a variability center along the equator in the eastern equatorial Pacific associated with the TIWs. Summary