Download
1 / 58
580 likes | 702 Views
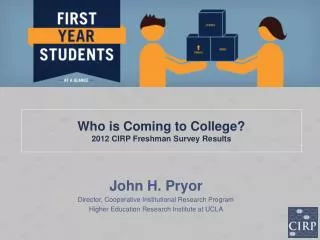
Who is Coming to College? 2012 CIRP Freshman Survey Results. John H. Pryor Director, Cooperative Institutional Research Program Higher Education Research Institute at UCLA. Higher Education Research Institute. We believe in the transformative power of higher education.

E N D
Who is Coming to College? 2012 CIRP Freshman Survey Results John H. Pryor Director, Cooperative Institutional Research Program Higher Education Research Institute at UCLA
Higher Education Research Institute We believe in the transformative power of higher education
CIRP Freshman Survey Comprehensive survey of incoming first-time full-time college students at four-year institutions Beginning of longitudinal research program that continues with the YFCY, DLE, and CSS 47th year and over 15 million students total
CIRP Freshman Survey 2012 • Administered at • 389 four-year institutions • 236,937 students • “Norms” • 283 four-year institutions • 192,912 students • Weighted to 1.5 million entering four-year institutions
CIRP Conceptual Framework • Student experience is comprehensive, multifaceted and inter-related, not focused on one or two issues • Look at cognitive and affective domains • Collect data that is: • Behavioral (what students do, i.e., study, interact, etc) • Psychological (attitudes, values, self-concept) • Environmental (campus climate, residence type)
Astin’s I-E-O Model ENVIRONMENT YFCY/DLE/CSS (e.g., residence, interactions with peers and faculty, curricular and co-curricular experiences) INPUT CIRP Freshman Survey (previous academic performance, financial concerns, expectations, degree aspirations, self-concept in high school, race, sex) OUTCOME YFCY/DLE/CSS (gains in college, satisfaction with college, retention, post-college plans)
Impact of Economics Expectations and Reality of Time to Graduation Support of Same-Sex Marriage Political Views and Orientation between 2008 and 2012 Revised Majors in 2012 Pre-Med or Pre-Law Track Differences in Math Preparation Specific Habits of Mind on the Rise Feeling Overwhelmed as High School Seniors Where Students Reside
Impact of Economics Expectations and Reality of Time to Graduation Support of Same-Sex Marriage Political Views and Orientation between 2008 and 2012 Revised Majors in 2012 Pre-Med or Pre-Law Track Differences in Math Preparation Specific Habits of Mind on the Rise Feeling Overwhelmed as High School Seniors Where Students Reside
Increased Importance of Financial Reasons(% Indicating “Very Important”)
Impact of Economics Expectations and Reality of Time to Graduation Support of Same-Sex Marriage Political Views and Orientation between 2008 and 2012 Revised Majors in 2012 Pre-Med or Pre-Law Track Differences in Math Preparation Specific Habits of Mind on the Rise Feeling Overwhelmed as High School Seniors Where Students Reside
Time to Degree • New in 2012 • “How many years do you expect it will take you to graduate from this college?” • Importance in college choice: • “The percentage of students who graduate from this college”
Time to Degree • Only 8.6% believe they will take 5 years • National figure is 15.8% • 2.7% believe they will take 6 years • National figure is 4.5%
5yr Degree and Prospective Major 19.1% Engineering 14.0% English
Time to Degree “The percentage of students that graduate from this college” was “very important” to only 30.4%
Impact of Economics Expectations and Reality of Time to Graduation Support of Same-Sex Marriage Political Views and Orientation between 2008 and 2012 Revised Majors in 2012 Pre-Med or Pre-Law Track Differences in Math Preparation Specific Habits of Mind on the Rise Feeling Overwhelmed as High School Seniors Where Students Reside
Support for Same-Sex Marriage(% Indicating “Agree Strongly” or “Agree Somewhat”)
Support for Same-Sex Marriage (% Indicating “Agree Strongly” or “Agree Somewhat”)
Impact of Economics Expectations and Reality of Time to Graduation Support of Same-Sex Marriage Political Views and Orientation between 2008 and 2012 Revised Majors in 2012 Pre-Med or Pre-Law Track Differences in Math Preparation Specific Habits of Mind on the Rise Feeling Overwhelmed as High School Seniors Where Students Reside
Support for Social and Political Views, by Year(% Indicating “Agree Strongly” or “Agree Somewhat”)
Wealthy Should Pay More Taxes • (% Indicating “Agree Strongly” or “Agree Somewhat”)
Impact of Economics Expectations and Reality of Time to Graduation Support of Same-Sex Marriage Political Views and Orientation between 2008 and 2012 Revised Majors in 2012 Pre-Med or Pre-Law Track Differences in Math Preparation Specific Habits of Mind on the Rise Feeling Overwhelmed as High School Seniors Where Students Reside
Updated Majors • Reflect contemporary majors • Biology (from 8 to 12) • Engineering (from 8-13) • Business (from 8 – 12) • No large changes between categories • Business continues to be the largest (14.4%) • 14.1% Health professions • 12.6% Biological sciences • 10.4% Engineering
Impact of Economics Expectations and Reality of Time to Graduation Support of Same-Sex Marriage Political Views and Orientation between 2008 and 2012 Revised Majors in 2012 Pre-Med or Pre-Law Track Differences in Math Preparation Specific Habits of Mind on the Rise Feeling Overwhelmed as High School Seniors Where Students Reside
New for 2012 19.3% Pre-med 6.3% Pre-law
Academic Major Intentions among Pre-Med and Pre-Law Students
HBCU Differences • Historically Black Colleges and Universities enroll the largest percentage of both • Pre-med 22.9% vs 19.3% • Pre-law • 10.5% vs 6.3%
Occupational Connections • Pre-med • 35.7% Physicians • 11.7% Nurses • 2.1% Research Scientists
Occupational Connections • Pre-law • 46.8% Attorney • 11.3% Business • 6.8% Law enforcement • 5.1% Government
Impact of Economics Expectations and Reality of Time to Graduation Support of Same-Sex Marriage Political Views and Orientation between 2008 and 2012 Revised Majors in 2012 Pre-Med or Pre-Law Track Differences in Math Preparation Specific Habits of Mind on the Rise Feeling Overwhelmed as High School Seniors Where Students Reside
New for 2012 Historically asked how many years of a subject (English, Math, Music, etc) recommended years in Nation at Risk Research on math level indicates a connection with retention
Type of High School Math Courses Completed, by Pre-Med Intention
Impact of Economics Expectations and Reality of Time to Graduation Support of Same-Sex Marriage Political Views and Orientation between 2008 and 2012 Revised Majors in 2012 Pre-Med or Pre-Law Track Differences in Math Preparation Specific Habits of Mind on the Rise Feeling Overwhelmed as High School Seniors Where Students Reside
Slight Rise in Selected Habits of Mind(% Indicating “Frequently” or “Occasionally”)
Impact of Economics Expectations and Reality of Time to Graduation Support of Same-Sex Marriage Political Views and Orientation between 2008 and 2012 Revised Majors in 2012 Pre-Med or Pre-Law Track Differences in Math Preparation Specific Habits of Mind on the Rise Feeling Overwhelmed as High School Seniors Where Students Reside
Trend of “Felt Overwhelmed by All I Had to Do”(% Indicating “Frequently”)