Download

1 / 20
200 likes | 293 Views
Delaware Department of Education 6/23/04. Delaware’s Accountability Plan for Schools, Districts and the State. Why Did We Start Over?. Federal legislation signed January 2002 (NCLB) Reauthorization of the Elementary and Secondary Education Act (ESEA) of 1965

E N D
Delaware Department of Education 6/23/04 Delaware’sAccountability Plan for Schools,Districts and the State
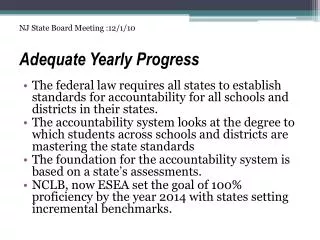
Why Did We Start Over? • Federal legislation signed January 2002 (NCLB) • Reauthorization of the Elementary and Secondary Education Act (ESEA) of 1965 • Delaware merged the existing state accountability processes with federal requirements for 2003-04
What Our System Allows • Ensure more valid and reliable accountability determinations • Monitor various subgroups progress at the school, district and state level • Support our value of continuous improvement
Accountability • Based on the performance of students taught in the school/district/state • DSTP – assessments used at grades 3,5,8, and 10 in reading, writing and math • Grades 4,6,8 and 11 science and social studies included in state progress determination
Calculations • System compares the % of students that meet/exceed DE content standards each year to previous years for ELA and math • Nine possible subgroups reviewed • Subgroup included for accountability decisions if there are 40 or more students
Subgroups • All students (the school as a whole) • American Indian • Asian American • African American • Hispanic • White • Economically Disadvantaged • Special Education • Limited English Proficient
Performance Target • % of students meeting the standards is compared to a State target of 57% in ELA, 33% in math (explained on the next slide) • Beginning in 2004, if performance target for subgroup is not met, a confidence interval is calculated
How do you determine Progress for the Performance Target? • Current year’s test data OR • Average of the current year and the previous year of test scores • **use the higher of the two measures**
Safe Harbor • To see if some change in lowest achieving students • Cell shows a 10% decrease in the % of students not meeting the standards not meeting the standards as compared to the previous year, AND • Cell shows progress on the Other Academic Indicator
Other Academic Indicators • Beginning in 2004, the Other Academic Indicator for elementary and middle schools is determined by improvement of the average scale scores of the students performing at PL1&2 in reading and math combined • OR • A decrease in the % of students performing at PL1 in reading and math • A confidence interval is used in the comparisons is used here also
AYP: a school, district or the state must meet -- • Participation Targets in ELA and math • Performance Targets in ELA and math, or attaining Safe Harbor • Maintain or show progress toward the Other Academic Indicator
AYP Status • Beginning in 2004, AYP status is expressed in terms of— • Above Target • Meets Target • Below Target
State Progress Determination • Calculated by formula • Reading, math, science, social studies included equally • Compares current year to last year
State Progress Determination • Beginning in 2004, State Progress status is expressed in terms of – • Above Target • Meets Target • Below Target
State Progress Determinations • Above -- growth of 6 points OR -- composite score of 75 or higher • Meets -- composite score of : 61-74 1 point growth 45-60 2 points growth • Below -- composite score of less than 45 OR --did not meet growth target
Ratings • Beginning in 2004, the overall rating in determined by a combination of AYP and State Progress determination • Various combinations or Above, Meets, and Below Target (for State and AYP) yield the overall rating
Ratings • Superior • Commendable • Academic Review • Academic Progress --Under Improvement • Academic Watch – Under Improvement
How to be Classified as Under Improvement • Two consecutive years not meeting AYP in same content area --ELA --Math --Other Academic Indicator
How to Move Out of Under Improvement • Must meet two conditions: --All targets must be met for two consecutive years in the content area(s) or other indicator that placed under improvement --Can fall below target in other content area(s) or other indicator for two consecutive years