Download
1 / 17
170 likes | 251 Views
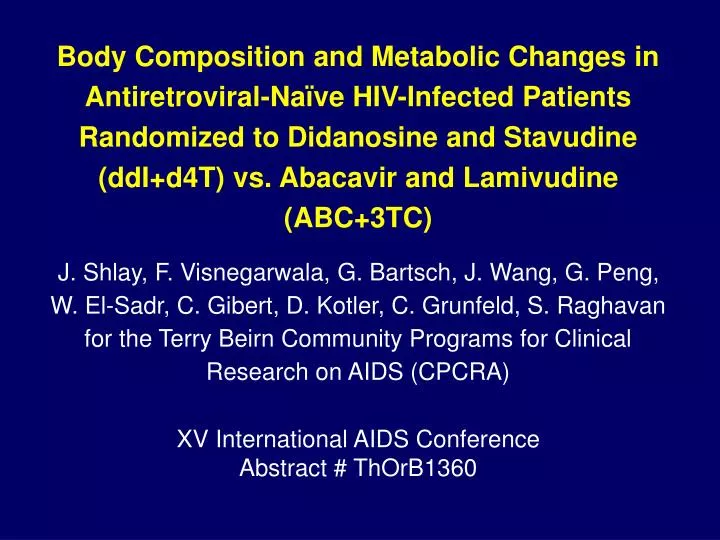
Body Composition and Metabolic Changes in Antiretroviral-Naïve HIV-Infected Patients Randomized to Didanosine and Stavudine (ddI+d4T) vs. Abacavir and Lamivudine (ABC+3TC).

E N D
Body Composition and Metabolic Changes in Antiretroviral-Naïve HIV-Infected Patients Randomized to Didanosine and Stavudine (ddI+d4T) vs. Abacavir and Lamivudine (ABC+3TC) J. Shlay, F. Visnegarwala, G. Bartsch, J. Wang, G. Peng,W. El-Sadr, C. Gibert, D. Kotler, C. Grunfeld, S. Raghavanfor the Terry Beirn Community Programs for Clinical Research on AIDS (CPCRA) XV International AIDS Conference Abstract # ThOrB1360
Objectives • To compare the rates of change in body composition and various metabolic parameters in antiretroviral naïve patients randomized to ddI+d4T vs. ABC+3TC containing regimens in the presence of highly active antiretroviral therapy
Background • Lipodystrophy has been associated with the use of thymidine analogue nucleoside reverse transcriptase inhibitors, particularly d4T • Few prospective studies have compared body composition changes in thymidine analogue-sparing regimens to thymidine analogue-containing regimens
Patient meets eligibility requirements Randomized to 3 strategy arms (1:1:1) N=1,397 (422 inMetabolic Substudy) PI + NRTI N=470 NNRTI + NRTIN=463 PI + NNRTI + NRTI N=464 Allowed additional randomization to NRTI Substudy (1:1) N=182 ddI+d4T N = 89 (46 in Metabolic Substudy) ABC+3TC N = 93 (50 in Metabolic Substudy) C•P•C•R•A
Methods • At baseline and every 4 months, the following measurements were obtained: • Anthropometric measurements: • centralized and standardized training; re-certification annually • height, weight, body mass index (BMI), • body circumferences: arm, waist, hip, thigh • skinfolds: triceps, suprascapular, subscapular, abdomen, thigh • body cell mass (BCM), total body fat (TBF) using BIA • Metabolic parameters: triglycerides, total cholesterol, HDL, LDL, VLDL, glucose, insulin (all also done at 1 month)
Baseline Characteristics - 1 ddI+d4T* N = 46 ABC+3TC* N = 50 Age (yrs) 38 35 Female (%) 30 26 Race (%)Non-white 76 76 Mean CD4 cells/mm3 268 234 Mean logRNA copies/ml 4.85 5.03 Initial PI (%) 70 70 * No significant differences between treatment arms
Baseline Characteristics - 2 ddI+d4T* N = 46 ABC+3TC* N = 50 Body compositionBMI (kg/m2) 25.0 24.7 BCM (kg) 26.5 26.6 TBF (kg) 17.4 16.6 Circumferences (cm)Waist 86.1 85.1Hip 99.6 97.6 Skinfold fat area (cm2)Mid-arm 20.7 21.6Waist 77.4 74.7 * No significant differences between treatment arms
Baseline Characteristics - 3 ddI+d4T* N = 46 ABC+3TC* N = 50 Triglycerides (mg/dL) 129.3 124.6 Total cholesterol (mg/dL) 177.3 161.4HDL cholesterol (mg/dL) 41.3 36.7LDL cholesterol (mg/dL) 111.8 99.8 Glucose (mg/dL) 82.4 83.0 Insulin (µ/mL) 9.4 11.6 Insulin resistance (HOMA)†: 2.1 2.5 * No significant differences between treatment arms † Insulin resistance = (0.0555 x glucose x insulin / 22.5)
Change(kg/m2/month) SE P-value ddI+d4T -0.02 0.02 0.01 ABC+3TC 0.04 0.02 C•P•C•R•A Rates of Change of Body Mass Index Body Mass Index (kg/m2) -2 -1 0 1 2 3 4 Mean Change from Baseline 0 4 8 12 16 20 24 28 32 No. of Patients Months 46 45 41 44 26 35 36 31 20 50 49 47 45 27 39 39 34 22 ddI+d4T ABC+3TC
0 4 8 12 16 20 24 28 32 Months Change(kg/month) SE P-value ddI+d4T 0.02 0.01 0.30 ABC+3TC 0.04 0.01 C•P•C•R•A * As measured by BIA Rates of Change of Body Composition Body Cell Mass* (kg) Total Body Fat* (kg) Mean Change from Baseline Mean Change from Baseline -5 0 5 10 -2 0 2 4 0 4 8 12 16 20 24 28 32 Months Change(kg/month) SE P-value ddI+d4T -0.08 0.04 <0.01 ABC+3TC 0.08 0.04
C•P•C•R•A Rates of Change of Circumferences Waist (cm) Hip (cm) 0 5 10 -15 -10 -5 0 5 10 15 Mean Change from Baseline Mean Change from Baseline 0 4 8 12 16 20 24 28 32 0 4 8 12 16 20 24 28 32 Months Months Change(cm/month) SE P-value Change(cm/month) SE P-value ddI+d4T -0.02 0.05 0.14 ABC+3TC 0.07 0.04 ddI+d4T -0.18 0.06 <0.01 ABC+3TC 0.10 0.06
C•P•C•R•A Rates of Change of Skinfold Fat Areas Mid - arm (cm2) Waist (cm2) -5 0 5 10 -40 -20 0 20 40 60 80 Mean Change from Baseline Mean Change from Baseline 0 4 8 12 16 20 24 28 32 0 4 8 12 16 20 24 28 32 Months Months Change(cm2/month) SE P-value Change(cm2/month) SE P-value ddI+d4T -0.21 0.06 <0.01 ABC+3TC 0.05 0.06 ddI+d4T -0.62 0.29 <0.01 ABC+3TC 0.62 0.27
C•P•C•R•A Rates of Change of Fat Free Areas Mid - arm (cm2) Waist (cm2) 0 50 100 -5 0 5 10 15 Mean Change from Baseline Mean Change from Baseline 0 4 8 12 16 20 24 28 32 0 4 8 12 16 20 24 28 32 Months Months Change(cm2/month) SE P-value Change(cm2/month) SE P-value ddI+d4T 0.01 0.06 0.81 ABC+3TC 0.03 0.06 ddI+d4T 0.32 0.56 0.91 ABC+3TC 0.41 0.53
C•P•C•R•A Rates of Change of Metabolic Parameters LDL Cholesterol* (mg/dL) HDL Cholesterol (mg/dL) -5 0 5 10 15 20 Mean Change from Baseline Mean Change from Baseline -20 0 20 40 0 4 8 12 16 20 24 28 32 0 4 8 12 16 20 24 28 32 Months Months Change(mg/dL/month) SE P-value Change(mg/dL/month) SE P-value ddI+d4T -0.66 0.16 0.08 ABC+3TC -0.26 0.16 ddI+d4T --0.11 0.08 0.03 ABC+3TC 0.13 0.08 * If triglycerides ≥400, direct LDL, otherwise calculated LDL
C•P•C•R•A Rates of Change of Metabolic Parameters Insulin (µ/mL) Triglycerides (mg/dL) Mean Change from Baseline Mean Change from Baseline --50 0 50 100 150 -10 0 10 20 0 4 8 12 16 20 24 28 32 0 4 8 12 16 20 24 28 32 Months Months Change(mg/dL/month) SE P-value Change(µ/month) SE P-value ddI+d4T 2.14 0.87 0.08 ABC+3TC 0.07 0.83 ddI+d4T 0.12 0.09 0.57 ABC+3TC 0.05 0.09
Conclusions - I • After initiation of HAART, an initial increase was seen in all body composition parameters (i.e., BMI, BCM, total and subcutaneous fat), regardless of the treatment arms • Progressive loss of total and regional fat was observed in the ddI+d4T arm compared to the ABC+3TC arm after the initial period, indicating a differential treatment effect • Significant early and sustained increases in insulin and insulin resistance was seen in the ddI+d4T arm compared to ABC+3TC, despite a similar proportion of PI use for each arm
Conclusions - II • The differential effects on lipid metabolism and insulin by treatment assignment necessitate close clinical monitoring and ongoing longitudinal assessment • Our study, using anthropometric measurements, yielded data consistent with the other studies that have utilized DEXA scans, supporting the use of these simple measures