Download
1 / 10
100 likes | 168 Views
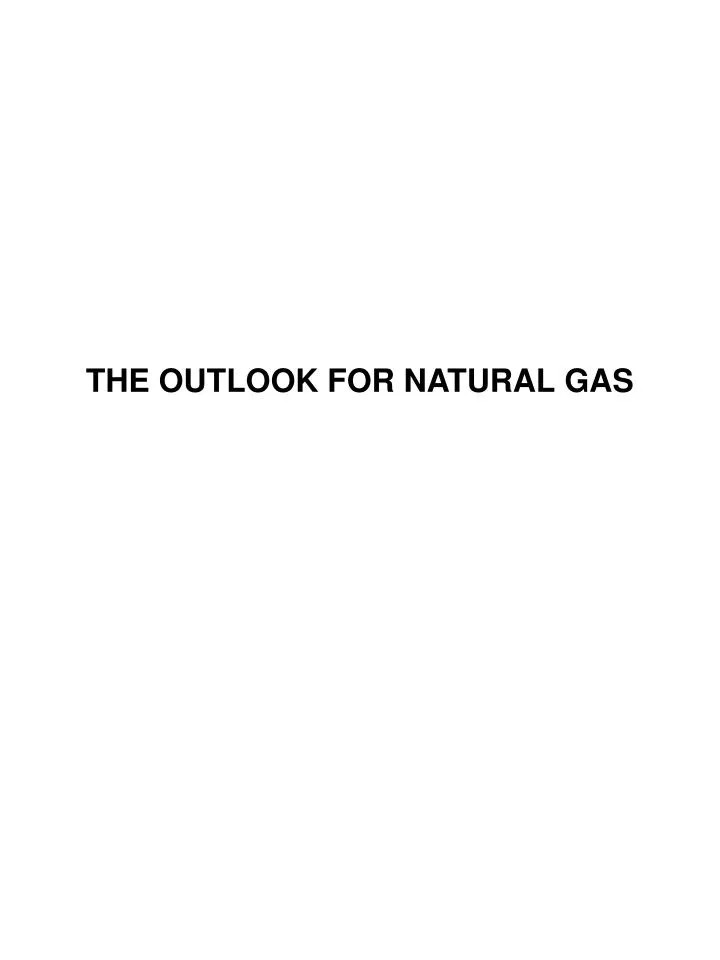
THE OUTLOOK FOR NATURAL GAS. Actual Forecast. Fuel Use Act. FIGURE 1. UNITED STATES NATURAL GAS CONSUMPTION. Bcfd. 64.6. 60.8. Boiler Fuel & Other. 52.8. 46.9. 22.2. 21.6. Residential & Commercial. GDP Trillion 2005$. Population Millions. Actual Forecast (Normal Weather).

E N D
Actual Forecast Fuel Use Act FIGURE 1 UNITED STATES NATURAL GAS CONSUMPTION Bcfd 64.6 60.8 Boiler Fuel & Other 52.8 46.9 22.2 21.6 Residential & Commercial
GDP Trillion 2005$ Population Millions Actual Forecast (Normal Weather) Trillion kwh Trillion Tcf Population 1.5 Gross Domestic Product (GDP) 1.4 1.3 1.2 Electricity 1.1 1.0 Gas FIGURE 2 UNITED STATES INDUSTRIAL NATURAL GAS AND ELECTRICITY - 300 310 296 281.4 237.9 $12.83 - 200 1.06 0.84 6.54 6.09 $5.68 4.79
Actual Forecast Deliverability Prorationing In Texas FERC Order 436 Price Controls Section 29 Tax Credits FIGURE 3 UNITED STATES NATURAL GAS PRODUCTION Bcfd 62.4 Gas Bubble Alaska Associated Coalbed Tight Shale GOM Lower 48 Conventional (Non-Associated)
Actual Forecast Price Controls Section 29 Tax Credits FIGURE 4 UNITED STATES NATURAL GAS PRODUCTION Bcfd Lower 48 Conventional (Non-Associated) Gulf of Mexico Tight Associated Canadian Imports Coalbed Shale LNG
Oil Field Gas Field Dry Hole Gas Well Oil Well 0 15 miles FIGURE 5 MISSISSIPPI CANYON AND NORTHERN EWING BANK Canyon Express Discovery Gas Transmission Southern Natural Canyon Chief (2003) Southern Natural Pompano Viosca Knoll Gathering GRAND ISLE WEST DELTA 22 29 Okeanos Pipeline 20 King Ochre 68 Horn Mountain 110 Tennessee 161 Alabaster Amberjack King's Peak SOUTH PASS Cognac Trunkline Mica 204 148 248 Matterhorn Aconcagua Rigel 17 Hands 305 241 311 656 ft Water depth Gemini Camden Hills Kepler Lena Crystal Ariel 1,640 ft (500 meters) Water depth Appaloosa Na Kika Santa Cruz Fourier Zinc Hawkes Zia Longhorn 555 AEDC Diamond Herschel Wrigley 486 503 Anstey Ringo Isabela GRAND ISLE Medusa Coulomb Blind Faith Mensa Thunder Hawk Tubular Bells 776 Kodiak Anduin Pluto Goldfinger 777 707 Princess Mars Thunder Horse Triton Devil's Tower King Gomez Deimos Thunder Bird Anduin Ursa Loon Independence Hub Lobster 4,920 ft (1,500 meters) Water depth Crosby 922 Slammer 964 Gladden Q Yorktown Freedom Morgus 6,560 ft (3,000 meters) Water depth Mirage Europa Morpeth Arnold 3,280 ft (1,000 meters) Water depth
FIGURE 6 CERRA AZUL 4 (1909) AND IXTOC (1979-1980) Shreveport Montgomery Jackson Savannah Waco Albany Brunswick Temple Natchez Jacksonville Austin Baton Rouge Pensacola Tallahassee San Antonio New Orleans Houston Galveston Orlando Rio Grande Tampa Laredo Corpus Christi Sarasota Monterrey Ciudad Victoria San Luis Potosi Cerra Azul 4 Leon Queretaro Merida Mexico City Campeche Ixtoc Toluca Puebla Chetumal Villahermosa Oaxaca Belize City BELIZE Belmopan Coban Puerto Lempira HONDURAS San Pedro Sula Tegucigalpa GUATEMALA Matagalpa NICARAGUA Bluefields Rivas
Actual Forecast Deliverability All Areas Texas & Louisiana Shelf $25 per acre Minimum Bid Nominations Area Wide Leasing Slope Eastern Shelf Gas Bubble Drainage Sales Only FIGURE 7 GULF OF MEXICO NATURAL GAS PRODUCTION Billion Cubic Feet Per Day @ 14.73 p.s.i.a. Bcfd 15.5 15.3 4.9 4.1 Pre-Macondo 3.1 Forecast 1.2 1.1 No Exploration 0.5
Actual Forecast Slope Texas & Louisiana Shelf $25 per acre Minimum Bid Area Wide Leasing Nominations Drainage Sales Only FIGURE 8 GULF OF MEXICO CRUDE AND CONDENSATE PRODUCTION Million Barrels Per Day 2.04 Pre-Macondo 1.63 Forecast 1.26 1.22 No Exploration 0.74
Actual Forecast FIGURE 9 UNITED STATES NATURAL GAS Henry Hub Price Bcf Price (Right Scale) YOY vs. 5-yr Average Inventory Change (Left Scale) YOY = Year on Year