Download
1 / 3
30 likes | 157 Views
Learn about the technical terms in a simple linear regression model and how to interpret coefficients, including yi, xi, ei, and the implications of b1 = 0.6.

E N D
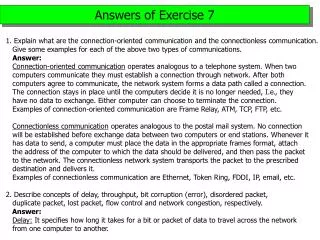
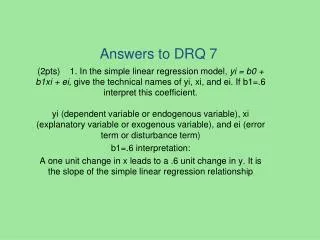
Answers to DRQ 7 (2pts) 1. In the simple linear regression model, yi = b0 + b1xi + ei, give the technical names of yi, xi, and ei. If b1=.6 interpret this coefficient. yi (dependent variable or endogenous variable), xi (explanatory variable or exogenous variable), and ei (error term or disturbance term) b1=.6 interpretation: A one unit change in x leads to a .6 unit change in y. It is the slope of the simple linear regression relationship
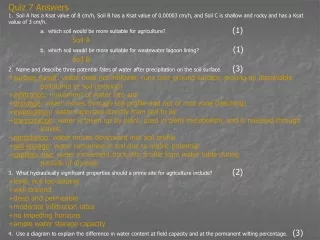
(2pts) 1. In the simple linear regression model, yi = b0 + b1xi + ei, give the technical names of yi, xi, and ei. If b1=.6 interpret this coefficient. ( 1pt) 2. (a) Which of the following diagrams best describes the relationship of units sold (CE) of a firm and A which corresponds to advertising expenditures of the firm? D is the answer (b) What is the technical name of the respective diagrams? Scatter plot 3. Concerning descriptive statistics of variable indigenous to regression analysis, (1/2 pt) The skewness coefficient for the variable PSE is -.35. The distribution of PSE has a tail on the __left____________. DRQ #7 Capps 5 pts October 11, 2011 c) a) b) d) . . A . CE . . A CE . . . . . . . . . . . . . . . . . . . . . . . . . . . . . . . . . . . . . . A A CE CE
( ½ pt) 4. The acronym OLS stands for Ordinary Least Squares. (1 pt) 5. Calculate the median of the following sample of observations for a variable labeled DTV: 18, 10, 14, 19, 17, 15, 12, 15, 21, 16, 11 Arrange in ascending order: 10,11,12,14,15,15,16,17,18,19,21 Median: the 50th percentile is 15