Master Advanced Debugging Techniques in Visual Studio with Ingo Rammer
Join Ingo Rammer from thinktecture for a detailed session on advanced debugging techniques in Visual Studio. This 'classic' session has a 10-15% annual update rate, ensuring you learn the latest enhancements. Discover how to utilize breakpoints effectively, manage multithreaded debugging, and debug foreign assemblies. Explore tools such as Intellitrace and Crash Dump Debugging for efficient troubleshooting. Perfect for software architects and developers looking to enhance their debugging skills. Don’t miss the chance to gain insights from an expert!


Master Advanced Debugging Techniques in Visual Studio with Ingo Rammer
E N D
Presentation Transcript
Advanced Debuggingwith Visual Studio Please note: this session is a „classic“ with a change/addition rate of about 10-15% per year. If you‘ve seen a previous version, you might therefore already know quite a bit of it .... (But you‘re of course more than welcome to join again! ;-)) Ingo Rammer | thinktecture | ingo.rammer@thinktecture.com | @ingorammer
Ingo Rammer and thinktecture • Support and consulting for software architects and developers • Architectural Consulting and Prototyping • Developer-Coaching and -Mentoring • Application Optimization, Troubleshooting, Debugging • Architecture and Code Reviews • Slides/Samples: http://weblogs.thinktecture.com/ingo • ingo.rammer@thinktecture.com • @ingorammer
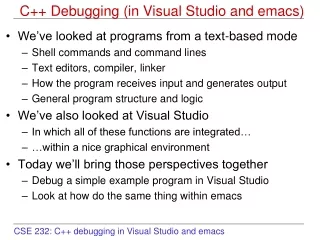
What else can I do with breakpoints? (Tracepoints, Groups, Conditionals, Macros) • How can I change the display for variables windows (from [DebuggerDisplay] to [DebuggerTypeProxy] and Debugger Visualizers) • How does VS support me with multithreaded debugging? • How can I debug foreign assemblies? (Breakpoints/Source stepping) • How should I work with Exceptions to simplify debugging? • How can I share information with another developer (breakpoint export, pinned variables)? • How can I isolate hard-to-reproduce problems during development? (Intellitrace) • How can I use Intellitrace during test? • How can I find problems which only happen at the user's computer? (Crash dump debugging) • Which other tools are essential?(DebugView, BareTail, Reflector Pro, LinqPad, Attach To Process-Macro ...)