Download
1 / 29
290 likes | 313 Views
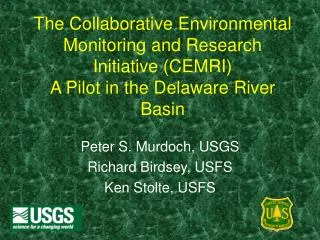
Multi-scale assessment of the extent and effects of soil calcium depletion and forest harvesting in the Delaware River Basin. Peter S. Murdoch, USGS Rakesh Minocha, USFS Jennifer Jenkins, USFS Gregory Lawrence, USGS Richard Hallet, USFS. Multi-tier Monitoring Design.

E N D
Multi-scale assessment of the extent and effects of soil calcium depletion and forest harvesting in the Delaware River Basin Peter S. Murdoch, USGS Rakesh Minocha, USFS Jennifer Jenkins, USFS Gregory Lawrence, USGS Richard Hallet, USFS
Multi-tier Monitoring Design • Tier One – Remote Sensing and Mapping • Wall-to-wall coverage; stratification • Tier Two – Extensive Inventories and Surveys • Representative regional statistical sample • Tier Three – Condition Sample (new) • Representative of specified condition classes • Tier Four –Intensive Areas • Relatively small number of specific sites Increasing spatial resolution Increasing temporal resolution
Mid-Atlantic from SeaWiFS Satellite Delaware Bay
Sample Intensification (Tier 4) at the Neversink River Watershed in the Delaware River Basin
Delaware River Basin: Frost Valley, NY 2000 Research plot results: soil and foliar calcium decreased from valley to ridge Minocha, USFS
Delaware River Basin: Frost Valley, NY 2000 Tree stress increased from valley to ridge Minocha, USFS
Stream Ca Response to Clearcutting Large nitrogen and calcium release despite very low calcium pools in soil
Tier 4 –USGS Stream Gages in the Neversink River Intensive Area Neversink River at Claryville
Intensive Stream Monitoring: Decline in calcium + magnesium concentrations (in microequivalents per liter) in streamwater of the Neversink River, 1952-2002
Research Site Results • Low calcium in soils is correlated with indicators of tree stress and dieback. • Calcium may be declining in tree tissue over time in the Neversink River Watershed. • Forest harvesting can release large amounts of Ca from even Ca-poor soils • Long-term trends indicate a decline in stream Ca concentrations since the 1970s • Stream acidification is correlated with low Ca concentrations in forest soils
Regional gradient study of stream and foliar Calcium concentration Net Primary Productivity Biogeochemical Status Foliar Chemistry Visible/IR Reflectance Soil Chemistry Stream Chemistry Site Continuous Regional subsample Scale R2 = 0.42 R2 = 0.33 Tier 3: Is regional foliar or soil chemistry correlated with stream chemistry? N NY Watersheds NH Watersheds Hallet, USFS
NYC water supply Tier 2: Nitrogen Deposition to the Delaware River Basin Fixed stations used to draw regional maps of N deposition. Highest deposition in the eastern Catskills and western Poconos. (Lynch, 2002, written com.)
Tier 2 – USFS Forest Inventoryand Analysis (FIA) Plots measured with a 5-year panel system to characterize forests of the Delaware River Basin. Added 3 soil samples at 3 depths to each forested plot, + stream survey. Focus on Appalachian Plateau (Northern Basin)
Tier 2: Soil Ca Map • Soil calcium is lowest in areas with highest nitrogen deposition • Patterns emerging: reflect bedrock, glacial history, and deposition patterns <0.1
Organic horizon shows similar pattern, but at higher concentrations <4
Tier 2: Stream water acid neutralizing capacity during two high-flow surveys in the upper Delaware River Basin
Calcium concentrations in stream water from 1st-order streams during two high-flow surveys, Delaware River Basin
The NASA Airborne Visible-Infrared Imaging Spectrometer (AVIRIS ) • Flown on a NASA ER-2 aircraft at an altitude of 20km • Measures 224 contiguous spectral bands from 400-2400nm • Spectral Resolution = 10nm • Spatial Resolution = 20m Tier 4: AVIRIS Airborne Visible/InfraRedImaging Spectrometer The resulting 224 band layer image is known as an “image cube”. When the data from each band is plotted on a graph, it yields a spectrum. Hallet, USFS
Low High 10 km Calibration Plots Predicted Foliar Ca for the WMNF Legend Calcium Level Hallet, USFS
AVIRIS Imagery of the Catskill Mountain Region Neversink River Basin Hallet, USFS
Comparison of land cover classification from 4 sources: • MODIS/AVHRR • Forest type/AVHRR • NLCD’92/2000TM • Hi-Res Photography
Management Implications • Forest harvesting practices need to consider the effect of removing Ca and Mg in logs on the long-term soil fertility and stream chemistry. • Regional strategies for forest management are possible through use of integrated “biogeochemical monitoring” at a range of scales.
Monitoring Implications • A fairly simple and inexpensive collaboration between the USFS and the USGS can result in greatly enhanced interpretive power of monitoring data (FIA, soil survey, stream surveys, USGS-LTM). • This example is only one of several issues addressed by the collaborative program tested in the Delaware River Basin. • Funding of existing monitoring programs can be leveraged through collaborations to enhance data yield. • We should “hang together lest we hang separately” (Benjamin Franklin)
Conclusions: • Scaling up from watershed to region requires forest information which the FIA plot layout is uniquely qualified to provide. • A link between the current forest research and FIA increases the value of both research and FIA data (ie. we can now say more about the regional landscape) • A little additional data collected on FIA plots can make that link possible -- e.g. soils chemistry and forest condition indicators.
The DRB-CEMRI project tested: • How this integration between process-level studies and FIA-level monitoring might work, and • What types of data are required for 'scaling-up' of process-level information, and how that data might be collected.
What did we do together? • LINKED FIA TO REGIONAL STREAM, SOIL, AND DEPOSITION DATA, AND FACILITATEDTHE FIRST MULTI-SCALE ASSESSMENT OF FOREST CONDITION THROUGH USE OF FIA AND ANCILLARY DATA • SOILS DATA : FIA collected soils and provided field methods testing. USGS provided laboratory analysis of soils, methods design, and field support. • ASSOCIATED ECOSYSTEM RESEARCH: FIA USGS supplied LT stream research and monitoring, regional stream survey linked to FIA. FIA provided plot data. FHM provided research at intensive watersheds, intensive plot data, estimates of carbon flux. • A comparatively simple and inexpensive collaboration between the USFS and the USGS can result in greatly enhanced interpretive power of monitoring data (FIA, soil survey, stream surveys, USGS-LTM).