Download
1 / 24
240 likes | 252 Views
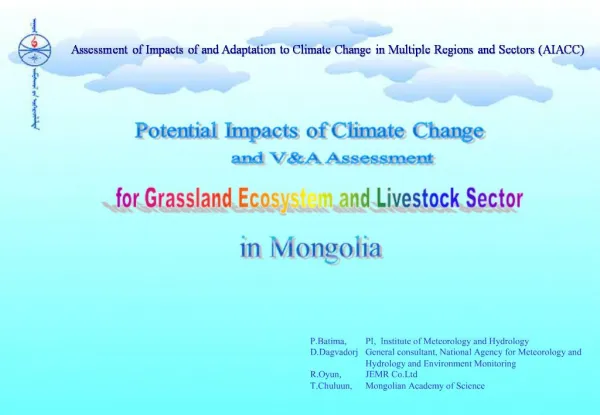
Assessment of Impacts of and Adaptation to Climate Change in Multiple Regions and Sectors (AIACC). Potential Impacts of Climate Change and V&A Assessment for Grassland Ecosystem and Livestock Sector in Mongolia. Data, Trends and Scenarios. Asia-Pacific Regional Workshop

E N D
Assessment of Impacts of and Adaptation to Climate Change in Multiple Regions and Sectors (AIACC) Potential Impacts of Climate Change and V&A Assessment for Grassland Ecosystem and Livestock Sector in Mongolia Data, Trends and Scenarios Asia-Pacific Regional Workshop Bangkok, 24-27 March 2002 P.Batima, Natsadorj, P. Gomboluudev, Natsagsuren, Erdenetsetseg, Institute of Meteorology and Hydrology
Climate • Temperature • Precipitation • 1945, 40
Natural resources base • Water resources (1945, 20) • Monthly discharge • Ice event • Spring and summer flood • Snow cover (1960, 30) • Dates • Soil (1960, 20-30) • Moisture • Thawing and freezing • Permafrost
Pasture • Productivity (1960) • Phenology
Animal husbandry • Animal weight (1980, 3) • Productivity • Wool • Cashmere • Dates on
Recent Climate Change Trends in Mongolia Annual air temperature increased an average by 1.660C
GHG SRES scenarios • High Emissions A1FI • Medium-High Emissions A2 (IPCC, DDC) • Medium-Low Emissions B2 (IPCC, DDC) • Low Emissions B1 • 540-970 ppm
Model Temperature Observed Simulation BIAS St. deviation Variation 1.HadCM3 Annual mean 0.66 -0.44 1.13 1.32 1.75 Summer 17.02 16.22 0.79 1.46 2.14 Winter -17.55 -18.42 0.92 3.21 10.03 2. CGCM3 Annual mean 0.66 -7.06 7.63 4.78 22.88 Summer 17.02 12.16 4.75 3.39 11.55 Winter -17.55 -27.06 9.44 6.76 45.4 3. CSIRO Annual mean 0.66 -0.86 1.54 3.25 10.54 Summer 17.02 19.18 -2.16 3.33 11.06 Winter -17.55 -18.02 0.53 5.27 27.27 How accurate is the climate model?
Simulation of Current Climate, 1961-1990 January July
Time slice Winter Summer Annual Temperature, Celsius 2020 0.85 1.99 1.37 2050 2.37 3.53 2.81 2080 3.89 6.35 4.88 Precipitation, mm 2020 5.0 -5.2 9.1 2050 8.2 15.1 44.3 2080 14.2 13.6 55.4 Climate Change Scenarios under SRES A2 emission scenarios by HadCM3 Climate Model
Annual mean temperature, HadCM3 A2 1961-1990 2020 2050 2080