Download
1 / 45
510 likes | 748 Views
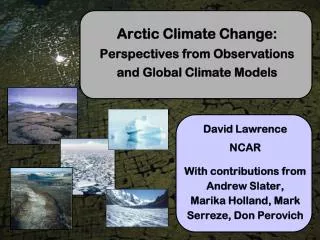
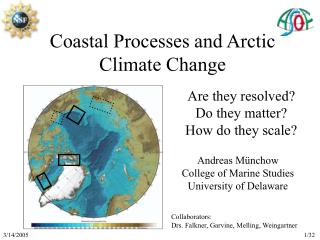
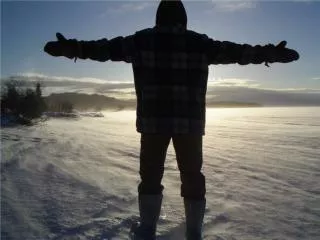
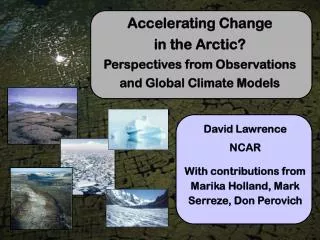
Arctic Climate Change: Perspectives from Observations and Global Earth System Models . David Lawrence NCAR With contributions from Andrew Slater, Marika Holland, Mark Serreze, Don Perovich. 15 of the last 16 years (1995-2010) rank among the 15 warmest years on record.

E N D
Arctic Climate Change: Perspectives from Observationsand Global Earth System Models David Lawrence NCAR With contributions from Andrew Slater, Marika Holland, Mark Serreze, Don Perovich
15 of the last 16 years (1995-2010) rank among the 15 warmest years on record Warmest 15 years: 2010,1998,2007, 2009, 2008, 2005,2003,2002,2004,2006,2001,1997,1995,1999,2000 50 0.1280.026 100 0.0740.018 Global mean temperatures are rising faster with time x x Period Rate Years /decade (Figure from IPCC AR4)
Spatial pattern of warming Arctic warming at roughly twice the rate of the rest of the world
Arctic sea ice is disappearing … Stroeve et al. 2008
Greenland Ice Sheet is melting … • 16% increase in melt area between 1979 and 2002 • new record in 2007 (60% increase in area)
Sea level rise from thermal expansion of ocean water and melting glaciers • Since 1993 • Global sea level • has risen 43 mm • (1.7 inches) • 60% from expansion as ocean temp. rise • 40% from melting glaciers • Steve Nerem
IPA Permafrost Distribution Map … and permafrost is degrading Long term monitoring site in Sweden Continuous (90 – 100%) Discontinuous (50 – 90%) Sporadic (10 – 50%) Isolated (0 – 10%) Brown et al. 1998
Biomes are shifting (tundra to shrublands) … Shrub cover increasing at 1.2% per decade since 1950, 15% to 20% cover(Sturm et al. 2001, Tape et al. 2006)
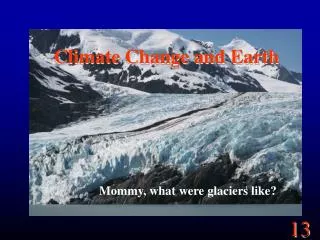
… and snowmen are melting … Nation's Snowmen March Against Global Warming January 25, 2006 | Issue 42-04 … Centigrade told the slowly melting snowcrowd that as recently as 15 years ago, the average life span of a snowperson built in late December was three weeks to a month. Today, that same snowperson has an average life span of two weeks.
Arctic climate and ecosystems are in transition • … Snow cover decreasing • River runoff to Arctic Ocean increasing • Lake and wetland distributions changing • Growing season is getting longer • More frequent forest fires • Rapid coastal erosion • …. See, e.g. Hinzman et al., Climatic Change, 2005 McGuire et al., Ann Rev Env Res, 2006 Serreze et al., Climatic Change, 2000 Arctic Climate Impact Assessment, 2004, updated in 2008
Global Climate Model Peering into the future ….
Global Climate (or Earth System) Models Global Coupled Ocean-Atmosphere-Land-Sea Ice model Climate models are a lot like weather forecast models, but include interactive ocean, land, and sea-ice components, and can also account for changes in atmospheric constituents like greenhouse gases. They are used to study the earth's past, present and future climate states.
How does a global climate model work? Land Model
Land-Surface Model Rainfall Canopy evaporation Transpiration Stomatal conductance: solar radiation, temp, humidity deficit, soil moisture, [CO2] … Nitrogen fertilization Photosynthesis model Throughfall Sublimation Surface runoff Soil evaporation T1, Soil hydrology model T2, T3, Runoff Vertical water flow Phase change Sub-surface runoff T10, , T*, zo …
NCAR Community Earth System Model (CESM1) • Coupled Ocean-Atmosphere-Land- Sea Ice-Carbon cycle model • 1oresolution (~60 sq. miles) • 30 minute time step • 31 atmosphere levels • 60 ocean levels • 15 ground layers • ~5 million grid boxes • ~1.5 million lines of computer code • Archive data (monthly, daily, hourly) for over 300 geophysical fields (in land model alone)
CCSM4: 1o resolution; Tsurf, clouds, P animation courtesy ETH Zurich
History of Climate Model to Earth System Model Development 2000s 2010
CESM Management Structure 12 working groups – encompass both model development and applications Polar BioGeo- Chemistry CESM Advisory Board Land Ice CESM Scientific Steering Committee Software Engineering Chemistry- Climate Societal Dimensions Paleo- Climate Whole Atmosphere Atmosphere Land Ocean Climate Variability and Change CESM CESM is primarily sponsored by the National Science Foundation and the Department of Energy http://www.cesm.ucar.edu/management
How do we evaluate and improve models? Compare against observations; if comparison is poor, then something is wrong
Soil (and snow) water storage (MAM − SON) GRACE (obs) CCSM4 CCSM3 GRACE satellite measures small changes in gravity which on seasonal timescales are due to variations in water storage CCSM3 and CCSM4 data from 1870 and 1850 control 300 200 100 0 -100 -200 -300 (mm)
How do we use these models to makeclimate change projections? Economists develop possible scenarios of population growth, economic growth, energy use, land use Depending on the scenario, more or less greenhouse gas emissions
Simulated global mean temperatures during last millenium and into 20th and 21st centuries Ammann et al.
Air Temperature: Typical “business as usual” scenario by 2100 Global mean warming of ~2.8oC (or ~5F);Much of land area warms by ~3.5oC (or ~6.3F)Arctic warms by ~7oC (or ~12.6F)
Abrupt reductions in the September sea ice cover September sea ice extent Ice Extent ( 106 km2 ) SSMI observed CCSM3 CCSM3 – smoothed “Abrupt” transition Holland et al., 2006
…and on broader Arctic climate … in the 1970’s D. Perovich, CRREL
Not far from today… D. Perovich, CRREL
3.5-fold increase in rate of warming over land during rapid sea ice loss September Sea- ice Extent Lawrence et al. 2008
Projections of degradation of near-surface permafrost in CCSM4 1970-1990 RCP2.6 (8.4) 2080-2100 RC8.5 (3.5) 2080-2100 Lawrence et al., 2012, J. Clim.
Why do we care? Feedbacks! Bernhard Edmaier National Geographic
Potential Arctic terrestrial climate change feedbacks Arctic Warming Permafrost warms and thaws
Potential Arctic terrestrial climate change feedbacks Carbon sequester Global warming CO2 efflux CH4 efflux Permafrost warms and thaws Enhanced [nitrogen] Expanded wetlands Arctic runoff increases Adapted from McGuire et al., 2006
Soil carbon in permafrost zone ISRIC-WISE/NCSCD merged Soil carbon in permafrost zone (PgC) Tarnocai et al. 2009
Potential Arctic terrestrial climate change feedbacks Carbon sequester Global warming CO2 efflux CH4 efflux Permafrost warms and thaws Enhanced [nitrogen] Expanded wetlands Arctic runoff increases Adapted from McGuire et al., 2006
Bernhard Edmaier National Geographic
B.S. and Ph.D. Degrees in CLM group • PhD (highest degree) • Chemical Engineering • Climatology • Geophysics (MS) • Ecology and Evolutionary Biology • Meteorology (MS) • Atmospheric Science • Environment and Resources • Atmosphere and Ocean Science • Geography • Hydrology and water resources • Geographical Sciences • Atmosphere and Ocean Science • Geology • Electrical and Computer Engineering • Geological and Environmental Sciences • Atmospheric Physics • Physics (Remote Sensing) • Aerospace Engineering • Geography • Environmental Sciences • Ecology and Evolutionary Biology • Ecosystem Ecology • Environmental Science • B.S. • Chemical Engineering • Biology/Geography • Physics/Geophysics/Geology • Environmental Science • Math/Geography • Chemical Engineering • Computer Science • Physics • Finance/Climate & Resource Management • Atmospheric Science • Computer Science • Physics • Environmental Science/Geology • Geology/Physics • Environmental Science • Physics/Math • Physics • Aerospace Engineering • Geography • Environmental Sciences • Biology • Horticulture • Biology
Bernhard Edmaier National Geographic
Bernhard Edmaier National Geographic
Bernhard Edmaier National Geographic